
Key Highlights
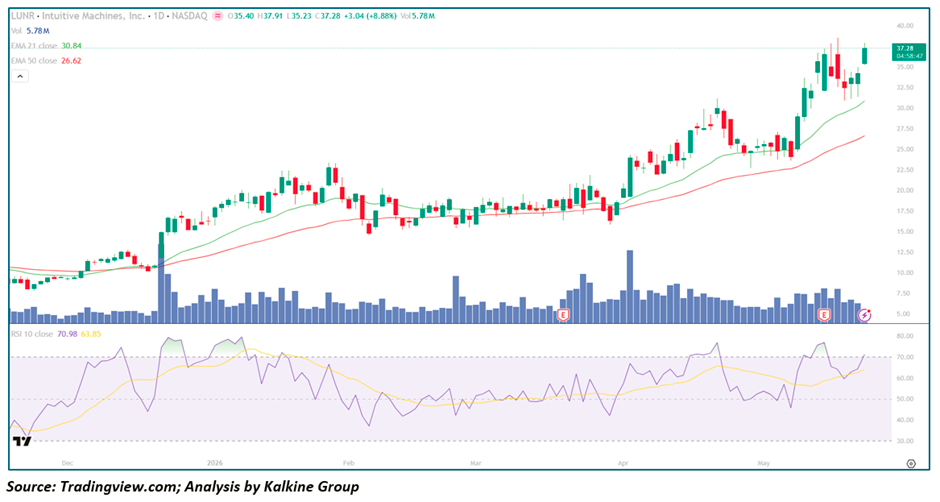
- LUNR closed at $37.28, surging +8.88% in a powerful continuation session
- Price traded between $35.23 and $37.91 intraday, closing near session highs — a sign of sustained buying pressure throughout the day
- The stock is trading significantly above both the EMA-21 ($30.84) and EMA-50 ($26.62), confirming a strongly bullish trend alignment
- RSI-10 at 70.98 has crossed into overbought territory with the signal line at 63.85 — momentum is accelerating, not fading
- Volume at 5.78M was robust, reflecting broad participation and genuine institutional interest
- LUNR has more than doubled from the March lows near $17, delivering a staggering advance in under three months
- Current price action reflects momentum expansion rather than speculative excess — the trend is running, not climaxing
Trend Structure: From Prolonged Base to Parabolic Leadership
Phase 1 — Base Building & Early Basing (Oct – Dec 2025)
LUNR spent the final quarter of 2025 in a tight, low-energy consolidation near the $8–$10 region:
- Both EMAs flat and closely wound, reflecting a market in equilibrium
- Volume minimal and directionless throughout the period
- Price action compressed into a narrowing range — the calm before the storm
- No meaningful trend in either direction, masking what would become a powerful accumulation phase
The extended dormancy of this period created the slingshot energy that powered the subsequent breakout.
Phase 2 — Initial Breakout & First Momentum Surge (Jan – Feb 2026)
An explosive Earnings or catalyst-driven volume spike in late January ignited LUNR's first major advance:
- Price surged from the $10 base to the $20–$22 region in a matter of sessions
- The volume spike at the breakout was extraordinary — a clear institutional fingerprint
- RSI entered overbought territory rapidly, confirming genuine momentum ignition
- Both EMAs began rising sharply as price pulled decisively clear above them
- A brief consolidation followed, with the stock finding support near the EMA-21
This first surge established LUNR as a legitimate momentum leader within the space economy theme.
Phase 3 — Consolidation & Re-Accumulation (Feb – Mar 2026)
Following the initial surge, LUNR entered a multi-week consolidation:
- Price oscillated between $15 and $22, digesting the rapid advance
- The EMA-21 and EMA-50 converged beneath price, building a tighter support platform
- RSI reset from overbought levels back to the 45–55 neutral zone — a healthy reload
- Volume contracted during this phase, confirming the absence of distribution
- The tight consolidation created the launchpad for the next — and far more powerful — advance
Phase 4 — Re-Acceleration & Parabolic Advance (Apr – May 2026)
The current phase represents a dramatic step-change in both pace and magnitude:
- Price broke out of the March consolidation range with force, reclaiming the EMA-21 decisively
- A persistent series of higher highs and higher lows developed through April and into May
- Multiple elevated-volume sessions aligned precisely with the strongest breakout candles
- Price has now advanced from $17 to $37 — a 118% gain — with today's 8.88% session adding further fuel
- The EMA-21 ($30.84) and EMA-50 ($26.62) are rising steeply in a powerfully bullish stack, well below current price
Moving Averages: Bullish Trend Structure at Maximum Strength
EMA-21 ($30.84)
- Rising sharply — the steepest upward slope seen throughout the entire chart history
- Sits approximately 17% below current price, reflecting the velocity of the advance
- Has consistently acted as the key support level during every pullback in the current phase
- A return to this level would represent a significant but entirely buyable correction
EMA-50 ($26.62)
- Turning higher decisively after months of flattening
- Sits approximately 29% below current price — confirming the extraordinary strength of the current move
- Represents the ultimate structural support line for the broader bull thesis
- The widening gap between the EMA-21 and EMA-50 signals a trend running at full velocity
The bullish EMA stack — price well above EMA-21, EMA-21 well above EMA-50, both rising steeply — is as clean and powerful a trend structure as exists in the current market.
Momentum Analysis: RSI Enters Overbought but Trend Remains the Boss
RSI-10 at 70.98 has crossed into overbought territory, with the signal line at 63.85 confirming the upward momentum crossover.
Current RSI behaviour suggests:
- Momentum is accelerating into overbought rather than fading from it — a key distinction
- In strong momentum stocks, RSI routinely sustains readings above 70 for extended periods
- The signal line at 63.85 sitting below the RSI confirms the bullish crossover is fresh and active
- Prior instances of RSI entering the 70+ zone in this chart were followed by continued short-term gains before any meaningful pullback
- Near-term traders should watch for RSI divergence — a lower RSI high on a new price high — as the first warning signal of exhaustion
Volume Analysis: Consistent Institutional Participation Validates the Move
Volume behaviour throughout LUNR's advance has been a consistent source of conviction for bulls.
Key observations include:
- Two major institutional-scale volume events bookend the advance — the January breakout spike and the April re-acceleration
- The current advance from April onward has been accompanied by consistently above-Average Daily Volume
- Today's 5.78M session volume is strong and confirms broad participation
- Down-days during the advance have consistently shown lighter volume than up-days — the defining characteristic of a healthy, institutionally supported uptrend
- No single heavy-volume Reversal day is visible — distribution, if present, is not yet detectable
Key Technical Levels
Resistance Levels
- $38–$40 — immediate psychological resistance and all-time high zone
- $45–$48 — measured move target based on the width of the March base breakout
- $55+ — longer-term momentum expansion target if space economy thematic accelerates
Support Levels
- $34–$35 — immediate intraday support and recent consolidation floor
- EMA-21 at $30.84 — primary dynamic support and key pullback buy zone
- $25–$26 — EMA-50 and major structural support
- $20–$22 — prior breakout zone and secondary structural support
Scenario Analysis
- Bullish Continuation (Primary Case)
If LUNR sustains above the $34–$35 support zone: → Momentum could extend toward the $40 psychological level and beyond → RSI sustaining above 70 would confirm a true momentum expansion phase → Space economy and lunar infrastructure thematic could continue attracting speculative and institutional inflows → Measured move target from the March base breakout points to the $45–$48 region
- Consolidation Phase (Healthy Outcome)
Following the sharp advance, a period of sideways digestion is entirely normal and constructive: → Price ranges between $32–$38 while RSI cools gradually → EMA-21 rises to meet price, tightening the base → A tight flag or pennant formation from current levels would set up the next powerful breakout leg
- Bearish Reversal (Risk Case)
A sharp reversal below $30 on heavy volume would signal a failed breakout: → First downside target near EMA-50 at $26.62 → Momentum structure would weaken materially on a close below EMA-21 → Given the parabolic nature of the advance, profit-taking risk is elevated — position sizing discipline is essential → This remains a secondary scenario while price holds above the EMA-21
Conclusion: LUNR Is One of the Most Compelling Momentum Charts in the Market Right Now
Intuitive Machines has transformed from a quiet, dormant small-cap into one of the market's most powerful momentum stories — and today's 8.88% surge to new highs on strong volume confirms that the bulls remain in complete control of the narrative. The technical structure is as clean as it gets: a multi-month base, a powerful breakout, a healthy consolidation, and now a parabolic re-acceleration with both EMAs rising steeply in bullish alignment.
The framework moving forward is clear:
- Above $34–$35 → bullish momentum dominant, target $40 and beyond
- Above $40 → psychological breakout, momentum expansion toward $45–$48
- Below EMA-21 at $30.84 → near-term caution, monitor for distribution signals
- Below EMA-50 at $26.62 → broader thesis under review
For momentum traders, LUNR is precisely the kind of chart that demands attention — a high-conviction, high-velocity trend in a thematically compelling sector, currently running at full speed with no technical evidence that the advance is over.


_06_25_2026_01_47_16_943609.jpg)
_06_25_2026_01_48_12_180710.jpg)
_06_25_2026_01_49_10_600130.jpg)

 Please wait processing your request...