
 CA
 NZ
 UK
 AU
 IND

 US

 Share
 X (Formerly Twitter)
 Whatsapp
 Facebook
 LinkedIn
 Telegram
 Email This Article
 Copy Link
 Summarize with AI
 Chat GPT
 Perplexity

Merck & Co., Inc. (NYSE: MRK) is under pressure on Thursday, extending a pullback from its late-August high. As of this chart snapshot (about 30 minutes before the close), shares are trading at $143.49, down $1.82 (-1.26%). The stock opened at $144.71, traded to a high of $145.39 and slid to a low of $143.26, with price pinned near the session low. The decline pushes MRK below the 21-day EMA for the first time since the summer. I could not find a company-specific catalyst, so the case rests on the chart. 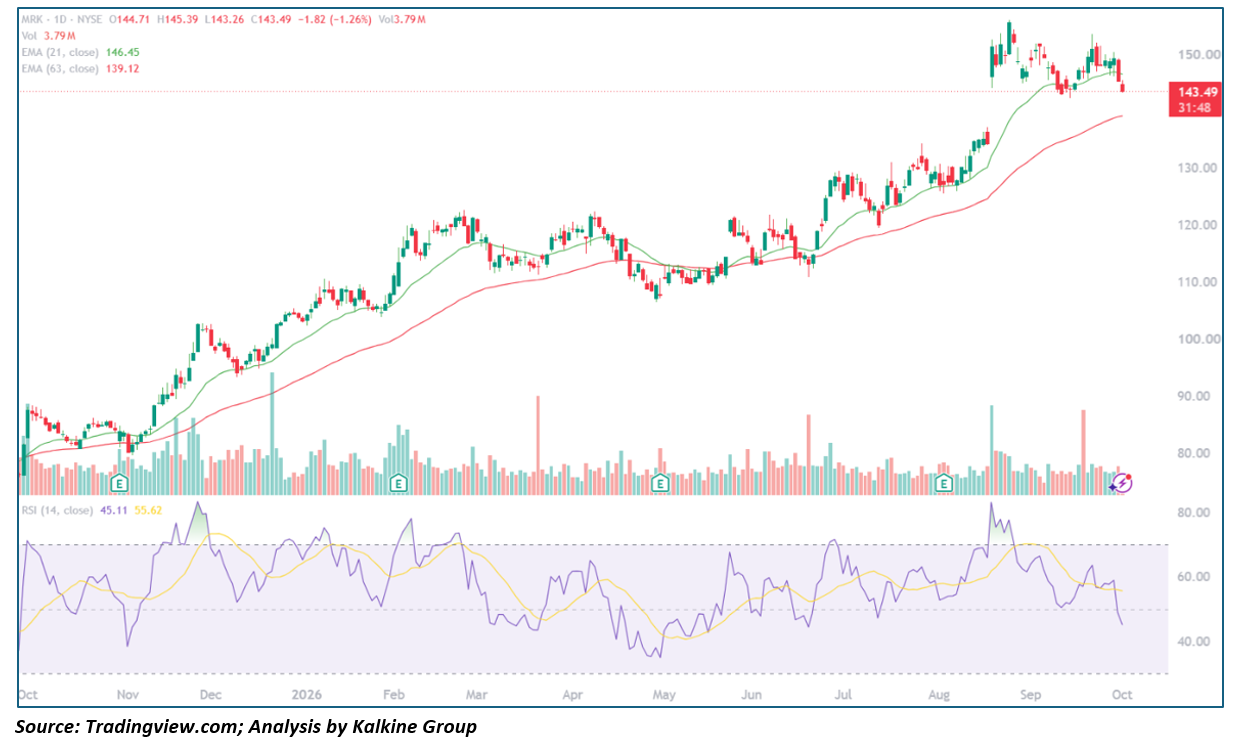
Key Highlights
- Trading at $143.49, down $1.82 (-1.26%), on partial-session Volume of 3.79M shares
- Opened at $144.71, high of $145.39, low of $143.26
- 21-day EMA at $146.45 (price below); 63-day EMA at $139.12 (about 3% below price)
- 14-day RSI at 45.11, well below its 55.62 signal line
- Resistance at $146.45 and $150; support at $141 to $142 and $139.12
Trend Structure: Three-Act Pattern
- Base and Advance (October 2025 – February 2026): The stock fell from the high $80s to about $80 in November, then rallied to roughly $103 by December and about $123 in late February, with pullbacks to the rising EMAs repeatedly bought.
- Range and Breakout (March – August 2026): MRK consolidated between about $107 and $122 through May, then broke out in June and rallied steadily to the mid-$150s, peaking near $155 in late August with RSI above 80.
- Pullback (September – October 2026): Price has moved sideways to lower in a $141 to $153 band, forming lower highs. Today's drop through the 21-day EMA and the $141 to $142 September lows is the first sign the consolidation may be resolving lower.
Backdrop
The next Earnings report is typically due in late October, so confirm the date. The stock is up roughly 75% from its November low, so a pullback toward the rising 63-day EMA would fit a healthy trend rather than break it.
Moving Averages and Momentum Profile
- Moving Average Stack: The 21-day EMA ($146.45) is well above the rising 63-day EMA ($139.12), so the broader trend remains positive even as price slips below the faster average.
- Oscillator Behavior: RSI at 45.11 has broken below 50 and below its signal line, the weakest reading since the June consolidation.
- Volume Behavior: Volume of 3.79M is partial, with the session still open. Selling on rising volume into the close would add weight to the break.
- Candle Structure: A close near the lows after a failed bounce is a mild bearish tell for the next session.
Key Technical Levels
|
Level |
Type |
Note |
|
$155 |
Resistance |
Late-August cycle high |
|
$150–$153 |
Resistance |
Early-September and late-September highs |
|
$146.45 |
Resistance |
21-day EMA |
|
$143.49 |
Reference |
Current price |
|
$141–$142 |
Support |
September lows |
|
$139.12 |
Support |
63-day EMA |
|
$130 |
Support |
Late-July consolidation area |
Actionable Technical Outlook
- A decisive close below $141 would open a drift toward the 63-day EMA near $139, where buyers stepped in during prior pullbacks.
- Reclaiming the 21-day EMA near $146.45 would suggest the dip is over and put $150 back in play.
- The bias is cautiously bearish short term within a larger uptrend. This is a technical read, not Investment advice.
Metadata
|
Field |
Value |
|
Headline |
Why is Merck (NYSE: MRK) down 1.3% and breaking below its 21-day EMA, and where is support? |
|
SEO title |
Merck (MRK) Falls Below 21-Day EMA: Support Levels to Watch |
|
Meta description |
Merck (NYSE: MRK) drops 1.3% to $143.49 and slips below its 21-day EMA. RSI 45, key support at $141 and $139 for traders. |
|
Slug |
why-merck-mrk-nyse-stock-falls-below-21-day-ema-support-levels |
|
Tags |
Merck, MRK, NYSE, pharmaceuticals, technical analysis, moving averages, support levels |
|
Ticker / Sector |
MRK / Health Care |
|
Verification status |
PARTIAL (levels read from the chart; catalyst not confirmed) |
|
Data as-of date |
October 1, 2026 (intraday) |


 Nov 15, 2026





 Please wait processing your request...