
Key Highlights
- RIVN is attempting to build a sustained recovery after collapsing from its post-IPO highs, with price action now showing improving technical structure and renewed investor confidence
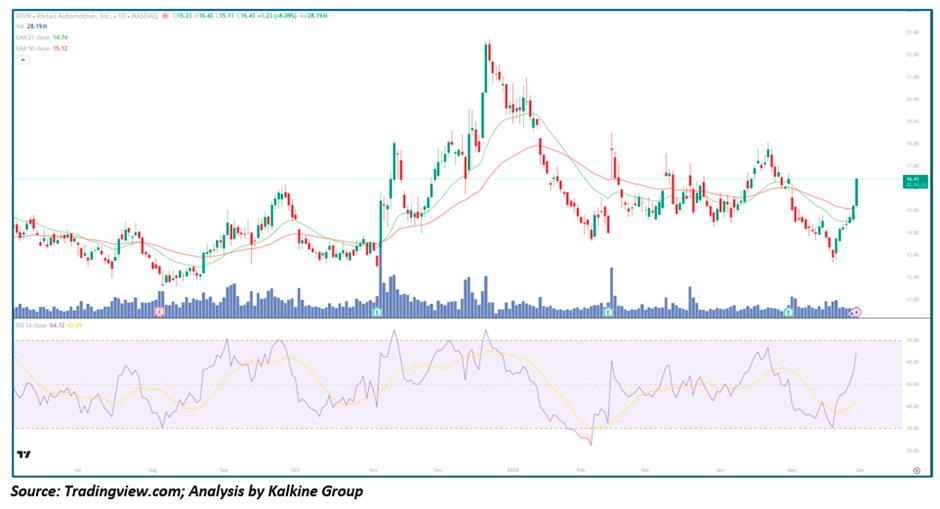
- The stock has recently reclaimed its 50-day Moving Average, signalling a potential transition from a prolonged bearish trend into a developing recovery phase
- RSI has rebounded from deeply oversold conditions toward neutral territory, indicating that selling pressure is fading while bullish momentum gradually strengthens
- Daily price action continues to form higher lows, a constructive technical pattern often associated with institutional accumulation and improving trend stability
- Volume activity on bullish sessions has consistently exceeded down-day volume, suggesting Demand is beginning to outweigh Supply at current levels
- Analysts are closely watching the $15–$18 region as the next major resistance and breakout zone if current momentum continues to strengthen
- The weekly MACD has shifted into bullish territory while Bollinger Bands are beginning to expand, signalling that a larger directional move may be developing
- Rivian continues to benefit from major strategic partnerships with Amazon and Volkswagen, both of which significantly strengthen the company’s Long-term Growth narrative
- The upcoming R2 platform launch remains one of the most important long-term catalysts, with management positioning it as Rivian’s gateway into the mass-market EV segment
Trend Structure: From Post-IPO Collapse to Emerging Recovery Formation
Phase 1 — Post-IPO Euphoria and Aggressive Collapse (2021 – 2022)
Following one of the largest IPO launches in EV history, Rivian initially traded with extreme speculative momentum before entering a brutal multi-year decline:
- Shares surged aggressively after listing as investors rushed into high-growth EV names during the peak of speculative market enthusiasm
- Valuation expanded rapidly despite limited production scale, leaving the stock highly vulnerable once broader market sentiment shifted
- Rising interest rates, supply chain disruptions, and mounting EV sector competition triggered sustained institutional selling pressure
- Price collapsed from triple-digit levels as investors aggressively repriced high-growth companies with Negative cash flow profiles
- RSI spent extended periods in oversold territory while moving averages rolled decisively lower, confirming the depth of the structural downtrend
This phase established the long-term Capitulation zone that would later become the foundation for a potential recovery base.
Phase 2 — Base Formation and Stabilisation (2023 – Early 2025)
After the sharp collapse, RIVN began entering a prolonged consolidation phase as Volatility gradually cooled:
- Price action stabilised near historically depressed levels, suggesting the majority of forced selling had likely exhausted itself
- The stock began trading within a broad accumulation range as institutional investors evaluated Rivian’s long-term survivability
- Volume gradually normalised during this period, reflecting reduced panic selling and more balanced positioning
- RSI recovered from persistent oversold readings and moved toward neutral territory, signalling that bearish momentum was weakening
- Multiple higher lows started appearing on the daily timeframe, an early technical indication that buyers were slowly regaining control
This stabilisation phase created the technical foundation necessary for a broader recovery attempt.
Phase 3 — Recovery Momentum and Breakout Potential (2025 – Present)
The most recent phase reflects improving confidence in Rivian’s production roadmap, partnerships, and long-term commercial viability:
- RIVN recently reclaimed its 50-day moving average, an important technical milestone often associated with shifting momentum conditions
- Daily structure continues to improve with higher lows and increasingly constructive consolidation behaviour
- Bullish volume expansion on recovery sessions suggests institutional Capital is gradually rotating back into the name
- Weekly MACD has crossed into bullish territory while Bollinger Bands begin widening, indicating rising volatility and the potential for a stronger directional move
- A sustained breakout above near-term resistance could trigger accelerated upside momentum toward the key $15–$18 target region
While volatility remains elevated, the broader technical structure is materially healthier than during previous failed recovery attempts.
Moving Averages: Early Bullish Reversal Signals Emerging
MA-50 Reclaim
- The recent recovery above the 50-day moving average represents one of the clearest technical improvements visible on the chart
- Sustained price acceptance above this level suggests short-term momentum may finally be transitioning in favour of the bulls
- The MA-50 is beginning to flatten after a prolonged decline, often an early precursor to trend reversal conditions
Long-Term Trend Context
- Despite the improving near-term structure, RIVN still trades well below historical highs, highlighting that the longer-term recovery remains in its early stages
- Additional confirmation would likely require stronger consolidation above current levels followed by a decisive breakout through major resistance zones
Momentum Analysis: RSI and MACD Point Toward Strengthening Recovery Conditions
RIVN’s momentum indicators are beginning to support the bullish recovery thesis:
- RSI has recovered significantly from oversold conditions and is now approaching neutral territory, signalling fading downside momentum
- The improvement in RSI reflects a gradual shift from panic selling toward more balanced market participation
- Weekly MACD has crossed bullishly, often a reliable medium-term momentum signal for trend reversals
- Expanding Bollinger Bands suggest volatility compression may be ending, potentially preceding a larger directional move
While momentum is improving, confirmation through stronger price expansion and follow-through volume remains essential.
Volume Analysis: Institutional Accumulation Signals Improving
Volume trends have become increasingly constructive during the recent recovery phase:
- Up-day volume has consistently exceeded down-day volume, suggesting buyers are becoming more aggressive at current price levels
- The improving volume profile contrasts sharply with the distribution-heavy environment seen during the earlier decline
- Institutional participation appears to be gradually increasing as confidence in Rivian’s operational execution improves
- No major capitulation-style selling waves are currently visible, reinforcing the idea that the stock may be transitioning into an accumulation phase
This shift in volume behaviour materially strengthens the technical recovery narrative.
Fundamental Catalysts: Partnerships and Production Progress Drive Optimism
Amazon Commercial Van Partnership
Rivian’s partnership with Amazon remains one of the strongest long-term pillars supporting the company’s growth outlook:
- Amazon’s commitment to purchase 100,000 electric delivery vans provides significant long-term Revenue visibility
- Ongoing delivery execution validates Rivian’s Manufacturing and scaling capabilities
- The commercial fleet segment offers Rivian differentiated exposure beyond consumer EV demand
Volkswagen Strategic Investment
The Volkswagen partnership has significantly improved Rivian’s strategic positioning:
- Volkswagen’s multi-billion-dollar investment validates Rivian’s software and electrical architecture capabilities
- The deal introduces the possibility of long-term licensing and technology revenue streams
- Strategic capital support reduces financing pressure and strengthens Balance Sheet confidence
R2 Platform Launch
The upcoming R2 launch remains Rivian’s most important long-term catalyst:
- The lower-priced platform is designed to dramatically expand Rivian’s addressable market
- Management expects the R2 lineup to target a broader mass-market demographic beginning in 2026
- Investors view the R2 rollout as critical for long-term production scaling and profitability expansion
Key Technical Levels
Resistance: $15–$18 (major breakout zone) → $20 (psychological level) → $25 (longer-term recovery target)
Support: Recent higher-low structure → MA-50 support → prior consolidation base
Conclusion
Rivian Automotive is showing increasingly credible signs of a technical and fundamental recovery after enduring one of the most severe post-IPO declines in the EV sector. The improving chart structure, reclaim of the 50-day moving average, strengthening RSI profile, and bullish MACD crossover collectively suggest that momentum may finally be shifting back in favour of the bulls. At the same time, Rivian’s strategic partnerships with Amazon and Volkswagen continue to reinforce confidence in the company’s long-term commercial potential and technology platform.
While the stock remains highly volatile and sensitive to broader EV sentiment, the combination of stabilising fundamentals, improving production execution, and strengthening technical conditions creates one of the more compelling recovery setups currently visible within the electric vehicle sector. A confirmed breakout above key resistance on strong volume could mark the beginning of a far larger re-rating cycle, particularly as investors begin positioning ahead of the highly anticipated R2 launch and the company’s next major growth phase.


 Please wait processing your request...