
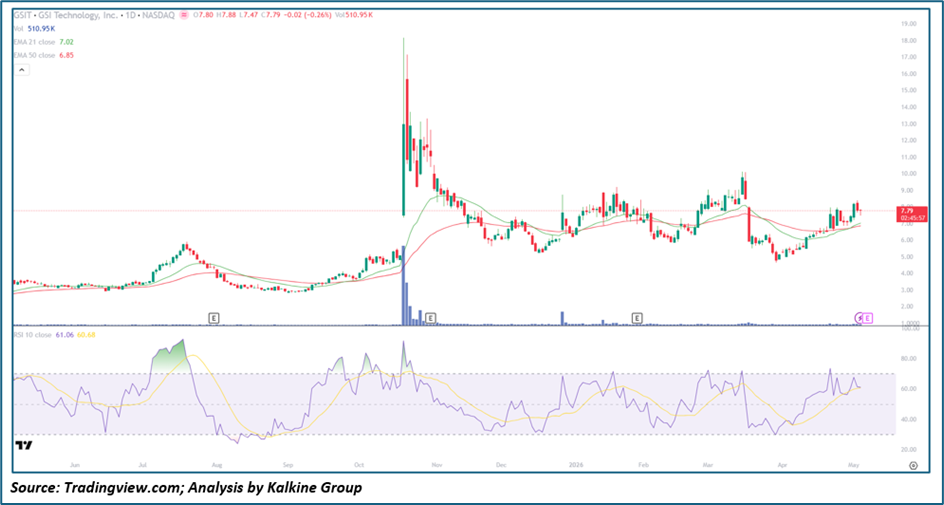
GSI Technology, Inc. Showing Trend Reversal Strength: EMA Crossover Signals Emerging Bullish Continuation
Key Highlights
• GSIT is trading near the 7.7–7.8 zone after recovering from March lows around 5.50
• Price has moved above both the 21-day (~7.02) and 50-day (~6.85) moving averages
• RSI near ~61 indicates strengthening momentum without overbought pressure
• Volume shows steady participation during the recovery phase
• Structure reflects base formation following post-spike consolidation
Trend Structure: Transition from Consolidation to Uptrend
GSIT is shifting from a prolonged consolidation phase into a potential uptrend.
Key observations include:
• Prior distribution phase between 6–10 has stabilized
• Formation of higher lows since February
• Early signs of trend reversal emerging
This suggests:
• Selling pressure has been absorbed
• Buyers are regaining control
• A new bullish phase may be developing
Price Action: Recovery with Accumulation
Recent price behavior shows improving structure:
• Strong bounce from 5.50 support zone
• Series of higher lows and steady green candles
• Controlled upward movement with minimal volatility spikes
This implies:
• Accumulation at lower levels
• Reduced downside risk
• Sustainable bullish participation
Moving Averages: Bullish Crossover Signal
The moving average structure indicates a shift:
• Price above both short- and medium-term EMAs
• EMA-21 crossing above EMA-50
• Both averages beginning to slope upward
Interpretation:
• Short-term trend turning bullish
• Medium-term trend transitioning positive
• Confirmation of potential sustained uptrend
Momentum Indicators: Strength Without Exhaustion
RSI behavior signals:
• RSI in 60–62 range
• Positive upward trajectory
• No overbought conditions
Interpretation:
• Momentum strengthening
• Room for further upside
• Healthy trend development
Volume Analysis: Recovery Confirmation
Volume trends indicate:
• Increased participation during upward moves
• Stable volume during consolidation
• No aggressive selling spikes
This suggests:
• Demand returning to the stock
• Recovery supported by real buying
• Reduced likelihood of false breakout
Market Structure: Base to Breakout Setup
The broader setup reflects:
• Parabolic spike followed by consolidation
• Base formation between 6–7 zone
• Attempt to move into higher trading range
This combination suggests:
• Early bullish continuation phase
• Need for breakout confirmation
• Moderate volatility during transition
Key Technical Levels and Scenarios
Support Levels
• 7.00 as immediate support (EMA-21)
• 6.50–6.85 as strong support (EMA-50 zone)
Resistance Levels
• 8.50–9.00 as immediate resistance
• 10.50 as next upside zone
Scenarios
- Bullish Continuation (Primary Case)
• Price holds above 7.00
• Breakout above 9.00
• Momentum strengthens
• Move toward 10.5+ - Consolidation (Secondary Case)
• Range between 6.50–9.00
• RSI stabilizes
• Base formation continues - Bearish Breakdown (Low Probability)
• Drop below 6.50
• Weakness resumes
• Retest of lower levels
Conclusion: Recovery Turning into Trend Continuation
GSIT is showing strong recovery characteristics supported by EMA crossover, improving momentum, and stable volume. A breakout above resistance could confirm a sustained bullish trend.
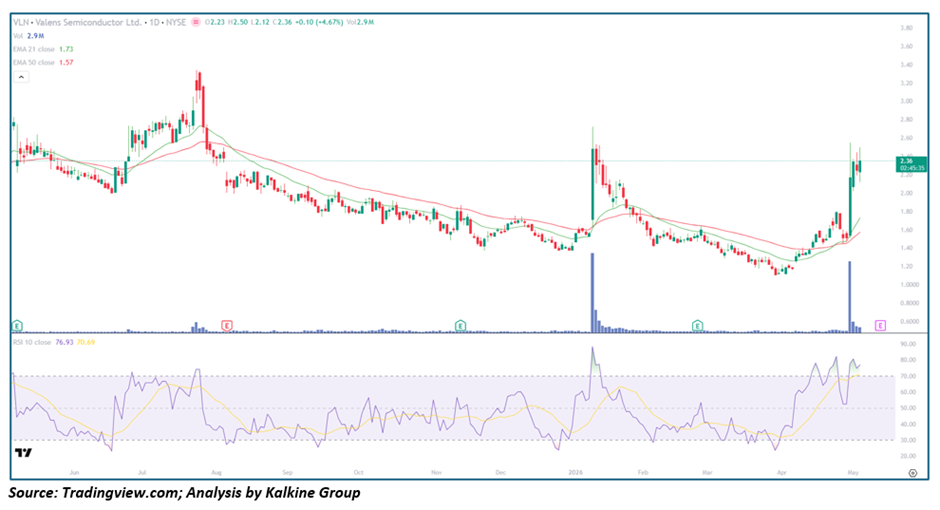
2. Valens Semiconductor Ltd. Showing Momentum Expansion: Overbought Rally with Strong Breakout Potential
Key Highlights
• VLN is trading near the 2.3–2.4 zone after a sharp recovery from prior lows
• Price is well above the 21-day (~1.73) and 50-day (~1.57) moving averages
• RSI near ~76–77 indicates overbought momentum
• Volume has expanded significantly during recent upside moves
• Structure reflects base formation followed by breakout
Trend Structure: Strong Recovery After Downtrend
VLN is transitioning from a prolonged decline into a strong uptrend.
Key observations include:
• Prior downtrend from 2.80 to 1.10 has stabilized
• Formation of a new base above previous lows
• Rapid price expansion from accumulation zone
This suggests:
• Downtrend has weakened
• Buyers have taken control
• Strong recovery phase underway
Price Action: Momentum-Driven Rally
Recent price behavior shows:
• Large bullish candles with follow-through
• Sharp upward expansion
• Limited pullbacks
This implies:
• Strong speculative and institutional participation
• Momentum-driven movement
• Increased volatility risk
Moving Averages: Extended Bullish Structure
The moving average setup indicates:
• Price significantly above EMAs
• EMAs sloping upward
• Wide gap between price and averages
Interpretation:
• Strong bullish trend
• Overextension from support levels
• Pullback toward EMAs likely
Momentum Indicators: Overbought Conditions
RSI signals:
• RSI above 75
• Strong upward momentum
• Elevated exhaustion risk
Interpretation:
• Momentum is powerful
• Short-term cooling likely
• Volatility expected
Volume Analysis: Strong Participation
Volume trends indicate:
• High activity during rallies
• Broad participation
• Sustained buying pressure
This suggests:
• Move is supported by demand
• Institutional interest likely
• Continuation depends on volume persistence
Market Structure: Breakout and Expansion
The broader setup reflects:
• Base formation after downtrend
• Breakout above prior resistance
• Rapid expansion phase
This combination suggests:
• Strong bullish continuation potential
• But with pullback risk
• Needs consolidation for sustainability
Key Technical Levels and Scenarios
Support Levels
• 2.00–1.90 as immediate support
• 1.73 as EMA-21 support
Resistance Levels
• 2.50–2.80 as key resistance
• 3.20+ as extended upside
Scenarios
- Bullish Continuation (Primary Case)
• Price holds above 2.00
• Break above 2.80
• Momentum continues
• Move toward 3.20+ - Consolidation (Secondary Case)
• Range between 2.00–2.80
• RSI cools toward 60
• Trend stabilizes - Bearish Pullback (Elevated Risk)
• Drop below 2.00
• Mean reversion toward EMAs
• Temporary trend pause
Conclusion: Strong Momentum with Elevated Risk
VLN shows powerful recovery momentum supported by volume, but overbought conditions increase the probability of short-term pullbacks before continuation.
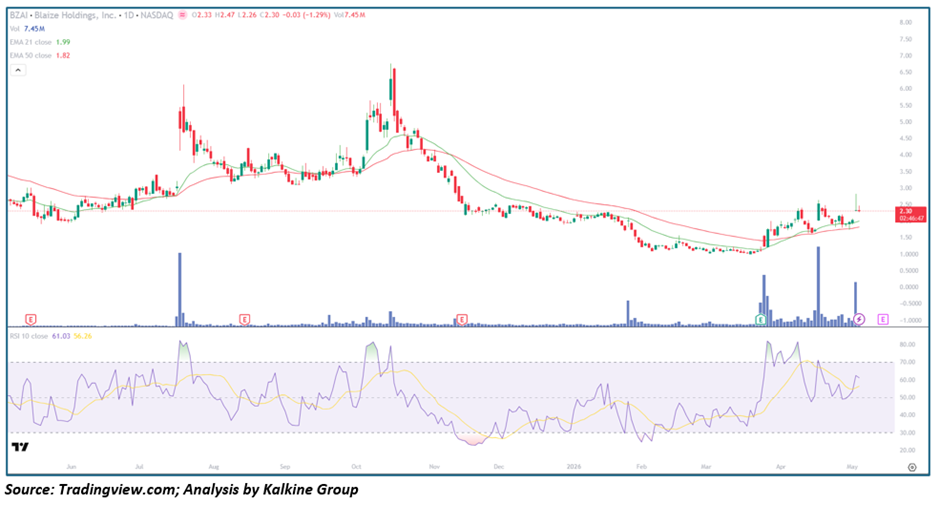
3. Blaize Holdings, Inc. Showing Accumulation Recovery: High-Volume Base Formation Signals Breakout Potential
Key Highlights
• BZAI is trading near the 2.3 zone within a consolidation range
• Price is above the 21-day (~1.99) and 50-day (~1.82) moving averages
• RSI near ~61 indicates constructive momentum
• Volume remains significantly elevated (~7M+)
• Structure reflects recovery after sharp drawdown
Trend Structure: Recovery After High Volatility
BZAI is transitioning from extreme volatility into stabilization.
Key observations include:
• Prior spike to 6.50 followed by sharp decline
• Formation of base near 1.80–2.00
• Gradual recovery with higher lows
This suggests:
• Selling pressure has subsided
• Accumulation phase underway
• Early-stage bullish trend forming
Price Action: Consolidation with Support
Recent behavior shows:
• Range-bound movement between 1.80–2.50
• Pullbacks being absorbed
• Controlled volatility compared to prior cycles
This implies:
• Market stabilizing
• Buyers active at support levels
• Preparation for breakout
Moving Averages: Bullish Alignment
The moving average structure shows:
• Price above both EMAs
• EMA-21 above EMA-50
• Both averages trending upward
Interpretation:
• Trend turning bullish
• Strong support base forming
• Healthy trend development
Momentum Indicators: Balanced Strength
RSI signals:
• RSI near 60–62
• Upward trend since February
• No overbought pressure
Interpretation:
• Sustainable momentum
• Room for upside
• Favorable setup for continuation
Volume Analysis: Strong Accumulation
Volume trends indicate:
• High trading activity
• Consistent participation
• Reduced selling intensity
This suggests:
• Institutional accumulation possible
• Strong liquidity support
• Breakout credibility improving
Market Structure: Consolidation Before Breakout
The broader setup reflects:
• Recovery from deep correction
• Base formation within range
• Testing of resistance zone
This combination suggests:
• Bullish continuation potential
• Need for breakout confirmation
• Moderate risk due to volatility history
Key Technical Levels and Scenarios
Support Levels
• 2.00 as immediate support
• 1.80 as major support
Resistance Levels
• 2.50 as immediate resistance
• 3.00–3.50 as upside zone
Scenarios
- Bullish Continuation (Primary Case)
• Price holds above 2.00
• Break above 2.50
• Volume expands
• Move toward 3.00+ - Consolidation (Secondary Case)
• Range between 1.80–2.50
• Base strengthens
• Gradual upward bias - Bearish Breakdown (Risk Case)
• Drop below 1.80
• Weakness resumes
• Retest of lower levels
Conclusion: Accumulation Phase with Breakout Setup
BZAI is showing improving structure supported by EMA alignment, strong volume, and constructive momentum, though volatility risk remains elevated.
Final Combined Conclusion: Recovery Momentum Across Small-Cap AI & Semiconductor Stocks
GSIT, VLN, and BZAI are all demonstrating recovery characteristics following prior corrections, with price reclaiming key moving averages and momentum indicators trending positively.
Key takeaways:
• GSIT offers the most balanced and stable bullish setup
• VLN shows the strongest momentum but carries overbought risk
• BZAI presents accumulation-driven recovery with higher volatility
Overall, the sector reflects renewed interest driven by AI infrastructure and semiconductor demand. While technical setups favor bullish continuation, confirmation through breakouts and sustained volume remains critical, and disciplined risk management is essential given the inherent volatility of small-cap names.


 Please wait processing your request...