 CA
 NZ
 UK
 AU
 IND

 US


…
Bank Hapoalim B.M., together with its subsidiaries, provides various banking and financial services in Israel, North America, Europe, and internationally. It operates through Households, Private Banking, Small Businesses and Microbusinesses, Mid-sized Businesses, Large Businesses, Institutional Entities, Financial Management, and Other segments. The company offers account-management services, lending for various purposes, deposits and savings plans, and capital-market services; housing loans; research and advisory services; and pension advisory and retirement planning services. It also provides products and services for the expansion of a business, advanced digital services, and a service center; credit for routine operations and investment financing, guarantees, letters of credit, foreign trade, and transactions in financial and derivative instruments, as well as investment services in various channels, such as foreign currency, shekels, and securities. In addition, the company offers financial products, including foreign-trade financing, financing of working capital, financing of assets overseas, complex financing transactions, syndication, and credit-risk transfers; and financing of construction projects, granting credit to customers, and issuing various types of guarantees to buyers of homes. Further, it provides managers of mutual funds, managers of investment portfolios, and managers of provident funds, study funds, and pension funds; trading activities; securities advising, underwriting, and distribution services; and brokerage and custody services. The company serves households, private-banking customers, foreign residents, small businesses, middle-market business clients, and large corporations, as well as financial-asset, mutual funds, investment portfolios, provident funds, study funds, and pension funds managers. Bank Hapoalim B.M. was incorporated in 1921 and is based in Tel Aviv-Yafo, Israel.
Source: TradingView
The charts and visual representations are sourced from TradingView through embedded widgets. For any issues with chart display, please visit the TradingView website
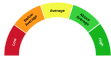
A unique technical analysis driven score developed by Kalkine showing momentum in stock prices based on select technical indicators identified.
Bank Hapoalim B.M. is one of Israel's largest universal banks, offering retail, commercial, corporate and investment banking, asset management and payments services domestically and through select international operations. Long-term growth may be supported by its scale in the Israeli market, diversified fee and lending streams, potential benefits from higher net interest margins and investments in digital channels that could improve efficiency and customer retention, which may interest investors seeking exposure to a major regional bank.
Key risks include concentrated exposure to the Israeli economy and geopolitical volatility, sensitivity to credit cycles and interest rates, and potential regulatory or legal developments that could affect capital and profitability.

Note: The summary and risk score provided above is created by AI and should not be construed as a recommendation of Kalkine.


| Breakdown | 2025-12-31 | 2024-12-31 | 2023-12-31 | 2022-12-31 | 2021-12-31 |
|---|---|---|---|---|---|
| Type | yearly | yearly | yearly | yearly | yearly |
| Date | 2025-12-31 | 2024-12-31 | 2023-12-31 | 2022-12-31 | 2021-12-31 |
| Income before tax | 14781.97M | 12194.00M | 11272.00M | 9982.00M | 7809.00M |
| Minority interest | - | 0.00M | 0.00M | -1.00M | 14.00M |
| Net income | 9755.12M | 7635.00M | 7360.00M | 6532.00M | 4914.00M |
| Selling general administrative | 257.00M | 540.00M | 540.00M | 852.00M | 886.00M |
| Selling and marketing expenses | 155.00M | 184.00M | 172.00M | 157.00M | 143.00M |
| Gross profit | 22893.99M | 21933.00M | 21311.00M | 17874.00M | 14300.00M |
| Reconciled depreciation | 764.00M | 764.00M | 802.00M | 756.00M | 617.00M |
| Ebit | 14781.97M | 12260.00M | 11272.00M | 10080.00M | 7872.00M |
| Ebitda | 15474.64M | 13024.00M | 12074.00M | 10836.00M | 8489.00M |
| Depreciation and amortization | 692.67M | 764.00M | 802.00M | 756.00M | 617.00M |
| Operating income | 14823.77M | 12260.00M | 11272.00M | 10080.00M | 7872.00M |
| Other operating expenses | 27977.56M | 28218.00M | 26925.00M | 7972.00M | 7803.00M |
| Interest expense | 18595.64M | 18545.00M | 16886.00M | 5753.00M | 1917.00M |
| Tax provision | 5093.00M | 4559.00M | 3930.00M | 3548.00M | 2958.00M |
| Interest income | 36788.00M | 35495.00M | 32971.00M | 19220.00M | 11684.00M |
| Net interest income | 18101.00M | 16950.00M | 16085.00M | 13467.00M | 9767.00M |
| Income tax expense | 5068.64M | 4559.00M | 3930.00M | 3548.00M | 2958.00M |
| Total revenue | 42759.53M | 40478.00M | 38197.00M | 17874.00M | 14300.00M |
| Total operating expenses | 8112.02M | 9673.00M | 10039.00M | 7972.00M | 7803.00M |
| Cost of revenue | 19865.54M | 18545.00M | 16886.00M | - | - |
| Total other income expense net | -41.80M | -66.00M | -2005.00M | -98.00M | -63.00M |
| Net income from continuing ops | 9802.00M | 7635.00M | 7360.00M | 6533.00M | 4900.00M |
| Net income applicable to common shares | - | - | - | 6532.00M | 4914.00M |
| Breakdown | 2025-12-31 | 2024-12-31 | 2023-12-31 | 2022-12-31 | 2021-12-31 |
|---|---|---|---|---|---|
| Type | yearly | yearly | yearly | yearly | yearly |
| Date | 2025-12-31 | 2024-12-31 | 2023-12-31 | 2022-12-31 | 2021-12-31 |
| Total assets | 762998.57M | 720844.00M | 686530.00M | 665353.00M | 638781.00M |
| Intangible assets | - | 1435.00M | 1459.00M | - | - |
| Other current assets | - | 634.00M | 439.00M | 260.00M | 260.00M |
| Total liab | 698630.88M | 662694.00M | 634100.00M | 618850.00M | 596034.00M |
| Total stockholder equity | 64367.69M | 58150.00M | 52430.00M | 46502.00M | 42735.00M |
| Deferred long term liab | - | - | - | 81.00M | 92.00M |
| Other current liab | - | 577044.00M | -5984.00M | -3759.00M | -3833.00M |
| Common stock | 7024.25M | 7775.00M | 8225.00M | 8212.00M | 8200.00M |
| Capital stock | 7058.00M | 7775.00M | 8225.00M | 8212.00M | 8200.00M |
| Retained earnings | 57684.81M | 51626.00M | 46275.00M | 41346.00M | 36117.00M |
| Other liab | - | - | - | 6947.00M | 8170.00M |
| Other assets | - | 720844.00M | -155480.00M | 396393.00M | 360534.00M |
| Cash | 63802.41M | 117053.00M | 107114.00M | 133424.00M | 189283.00M |
| Total current liabilities | 24194.74M | 584127.00M | 3490.00M | 3759.00M | 3833.00M |
| Net debt | 119.43M | -96299.00M | -85371.00M | -105951.00M | -163017.00M |
| Short term debt | 24194.74M | - | - | - | - |
| Short long term debt total | 63921.84M | 20754.00M | 22359.00M | 27473.00M | 26266.00M |
| Other stockholder equity | - | -1251.00M | -2070.00M | -3056.00M | -1582.00M |
| Property plant equipment | - | - | - | 2643.00M | 2855.00M |
| Total current assets | 94770.60M | 118934.00M | 108705.00M | 134983.00M | 189791.00M |
| Long term investments | 170290.00M | 145458.00M | 153889.00M | 130455.00M | 84901.00M |
| Net tangible assets | - | - | - | 45022.00M | 41344.00M |
| Short term investments | 30968.19M | - | -616.00M | - | - |
| Net receivables | - | 1247.00M | 975.00M | 1559.00M | 508.00M |
| Inventory | - | - | 1414.00M | - | 30.00M |
| Accounts payable | 4261.00M | 3979.00M | 3490.00M | 3759.00M | 3833.00M |
| Accumulated other comprehensive income | -341.36M | -1251.00M | -2070.00M | - | - |
| Non currrent assets other | 2319.85M | 140014.00M | 574285.00M | -133977.00M | -88456.00M |
| Non current assets total | 668227.97M | 601910.00M | 733305.00M | 133977.00M | 88456.00M |
| Breakdown | 2025-12-31 | 2024-12-31 | 2023-12-31 | 2022-12-31 | 2021-12-31 |
|---|---|---|---|---|---|
| Type | yearly | yearly | yearly | yearly | yearly |
| Date | 2025-12-31 | 2024-12-31 | 2023-12-31 | 2022-12-31 | 2021-12-31 |
| Investments | -13069.00M | -27007.00M | -27147.00M | -67966.00M | 1552.00M |
| Change to liabilities | - | - | - | 0.00M | 0.00M |
| Total cashflows from investing activities | -89680.06M | -27007.00M | -27147.00M | -67966.00M | -45869.00M |
| Net borrowings | 14934.00M | -2519.00M | -5489.00M | 11206.00M | 5369.00M |
| Total cash from financing activities | 28331.86M | 26467.00M | 1963.00M | 10546.00M | 91975.00M |
| Change to operating activities | - | - | - | 8182.00M | -3978.00M |
| Net income | 9755.12M | 7635.00M | 7360.00M | 6533.00M | 4900.00M |
| Change in cash | -43072.00M | 9418.00M | -25621.00M | -55859.00M | 50696.00M |
| Begin period cash flow | 116532.00M | 107114.00M | 132735.00M | 188594.00M | 137898.00M |
| End period cash flow | 71478.00M | 116532.00M | 107114.00M | 132735.00M | 188594.00M |
| Total cash from operating activities | 18482.19M | 9830.00M | -437.00M | 132.00M | 5178.00M |
| Depreciation | 764.00M | 764.00M | 802.00M | 756.00M | 617.00M |
| Other cashflows from investing activities | -53291.92M | -32550.00M | -21881.00M | - | - |
| Dividends paid | 3449.43M | 2284.00M | 2431.00M | -955.00M | -1479.00M |
| Sale purchase of stock | -790.20M | -463.00M | 0.00M | - | - |
| Other cashflows from financing activities | 18960.89M | 31733.00M | 17481.00M | 17314.00M | 99628.00M |
| Change to netincome | - | - | - | -6490.00M | -135.00M |
| Capital expenditures | 1068.86M | 980.00M | 970.00M | 700.00M | 886.00M |
| Change in working capital | 4790.98M | 2691.00M | -5833.00M | -666.00M | -218.00M |
| Stock based compensation | 18.00M | 15.00M | 13.00M | -12.00M | -6.00M |
| Other non cash items | 3936.09M | -1275.00M | -2779.00M | -6479.00M | -115.00M |
| Free cash flow | 17413.32M | 8850.00M | -1407.00M | -568.00M | 4292.00M |
Sector: Financial Services Industry: Banks - Regional
|
Stock Name
|
Change
(USD) |
Price
(USD) |
Trailing
PE (x) |
Forward
PE (x) |
Price Sales
TTM (x) |
Price to Book Value (x)
|
Enterprise Value
to Revenue (x) |
|---|---|---|---|---|---|---|---|
| DBSDY DBS Group Holdings Ltd ADR |
-4.69 2.27% |
202.06 | 20.00 | 17.57 | 7.54 | 3.17 | 13.19 |
| CIHHF China Merchants Bank Co Ltd Class H |
- -% |
6.64 | 7.70 | 7.10 | 0.55 | 0.83 | 3.51 |
| CIHKY China Merchants Bank Co Ltd |
0.12 0.35% |
33.92 | 7.79 | 7.20 | 0.55 | 0.85 | 3.51 |
| UNCFF UniCredit SpA |
- -% |
87.90 | 11.53 | 10.27 | 5.72 | 1.83 | 8.22 |
Bank Hapoalim B.M., together with its subsidiaries, provides various banking and financial services in Israel, North America, Europe, and internationally. It operates through Households, Private Banking, Small Businesses and Microbusinesses, Mid-sized Businesses, Large Businesses, Institutional Entities, Financial Management, and Other segments. The company offers account-management services, lending for various purposes, deposits and savings plans, and capital-market services; housing loans; research and advisory services; and pension advisory and retirement planning services. It also provides products and services for the expansion of a business, advanced digital services, and a service center; credit for routine operations and investment financing, guarantees, letters of credit, foreign trade, and transactions in financial and derivative instruments, as well as investment services in various channels, such as foreign currency, shekels, and securities. In addition, the company offers financial products, including foreign-trade financing, financing of working capital, financing of assets overseas, complex financing transactions, syndication, and credit-risk transfers; and financing of construction projects, granting credit to customers, and issuing various types of guarantees to buyers of homes. Further, it provides managers of mutual funds, managers of investment portfolios, and managers of provident funds, study funds, and pension funds; trading activities; securities advising, underwriting, and distribution services; and brokerage and custody services. The company serves households, private-banking customers, foreign residents, small businesses, middle-market business clients, and large corporations, as well as financial-asset, mutual funds, investment portfolios, provident funds, study funds, and pension funds managers. Bank Hapoalim B.M. was incorporated in 1921 and is based in Tel Aviv-Yafo, Israel.

50 Rothschild Boulevard, Tel Aviv-Yafo, Israel, 66883

972 3 567 3800

8409
| Name | Title | Year Born |
|---|---|---|
| Mr. Dov Kotler | Pres, CEO & Member of the Board of Management | 1956 |
| Mr. Yadin Antebi | Sr. Deputy MD, Head of Financial Mkts. & Intl Banking and Member of the Board of Management | 1970 |
| Ms. Eti Ben-Zeev | Sr. Deputy MD, Chief Information Officer, Head of Info. Technology & Member of Management Board | 1967 |
| Ms. Dalit Tova Raviv | Head of Retail Banking & Member of Management Board | 1969 |
| Mr. Barry Elram | Chief Exec. Officer of Hapoalim Switzerland | NA |
| Mr. Ram Gev | Sr. Deputy MD. CFO & Member of Management Board | 1975 |
| Mr. Zeev Hayo CPA, CPA | Head of Banking Services Division & Member of the Board of Management | 1961 |
| Ms. Yael Almog | Chief Legal Advisor & Member of the Board of Management | 1968 |
| Dr. Amir Bachar | Chief Internal Auditor, Head of Internal Audit in Israel and Abroad & Member of the Board of Mgmt. | 1972 |
| Mr. Amit Oberkovich | Head of HR & Member of the Management Board | 1964 |
Disclaimer - (*)This information, including any data, is sourced from Unicorn Data Services SAS, trading as EOD Historical Data (“EODHD”) on an ‘as is’ basis, using their API. We cannot guarantee the completeness or validity of the information and data provided on this page, as well as via the API. In some cases, the data may include analyst ratings or recommendations sourced through the EODHD API, which are intended solely for general information purposes.
This information does not consider your personal objectives, financial situation, or needs. Kalkine is not liable for any errors or omissions in the information provided or for any actions taken in reliance on it. You should seek advice from a financial adviser, stockbroker or other professional adviser (including taxation and legal advice) as necessary before acting on this information.

Download a free report with stock ideas and industry insights for general information.
Download Free Report Now →


Basic Materials
 -2.93%
Communication Services
-1.00%

Consumer Cyclical
-1.11%

Consumer Defensive
-0.41%

Energy
-1.31%

Financial Services
-1.34%
Financials
-3.22%

Healthcare
-1.31%

Industrials
-1.82%

Real Estate
-0.47%

Technology
-3.76%

Utilities
-0.71%
Note: Daily price change (%) by sector excluding stocks with +/-90% daily price change. Companies above $500 million market capitalization are considered.
 Portfolio
 Watchlist


 +-%
 Please wait processing your request...