 CA
 NZ
 UK
 AU
 IND

 US


…
Innovative Solutions and Support, Inc., a systems integrator, designs, develops, manufactures, sells, and services flight guidance, autothrottles, and cockpit display systems in the United States and internationally. It offers flat panel display systems that replicate the display of analog or digital displays on one screen and replace existing displays in legacy aircraft, as well as used for security monitoring on-board aircraft and as tactical workstations on military aircraft; and flight deck management system, a navigation and performance computer that upgrade for commercial air transport aircraft. The company also provides integrated standby units, which incorporate the measurement and display of attitude, altitude, airspeed, and navigation data into a single backup navigation instrument for military, commercial air transport, and corporate/general aviation applications. In addition, it offers digital air data computers that calculate various air data parameters, such as altitude, airspeed, vertical speed, angle of attack, and other information; integrated air data computers and display units, which calculate and convey air data information; altitude displays that convey aircraft altitude measurements; airspeed displays that convey various airspeed measurements; and altitude alerters. Further, the company offers the engine and fuel displays that convey information related to fuel and oil levels, and engine activity, including oil and hydraulic pressure and temperature; integrated global navigation systems; ThrustSense, a full regime autothrottle; and utility management systems. It serves commercial air transport carriers and corporate/general aviation companies, the Department of Defense and its commercial contractors, aircraft operators, aircraft modification centers, government agencies, and foreign militaries, as well as original equipment manufacturers. Innovative Solutions and Support, Inc. was incorporated in 1988 and is based in Exton, Pennsylvania.
Source: TradingView
The charts and visual representations are sourced from TradingView through embedded widgets. For any issues with chart display, please visit the TradingView website
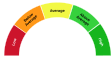
A unique technical analysis driven score developed by Kalkine showing momentum in stock prices based on select technical indicators identified.
Innovative Solutions and Support (ISSC) delivers engineering, maintenance and logistics services for government and commercial customers in aerospace, defense and maritime markets. Long-term growth may be driven by defense modernization spending, aftermarket service demand and expansion into systems-integration work. Investors may find it attractive for its contract-based recurring revenue and direct exposure to secular service demand.
Key risks include dependence on government contracts and defense budgets, competitive bidding and customer concentration, plus execution and margin pressure on fixed-price work.

Note: The summary and risk score provided above is created by AI and should not be construed as a recommendation of Kalkine.


| Breakdown | 2023-09-30 | 2022-09-30 | 2021-09-30 | 2020-09-30 | 2019-09-30 |
|---|---|---|---|---|---|
| Type | yearly | yearly | yearly | yearly | yearly |
| Date | 2023-09-30 | 2022-09-30 | 2021-09-30 | 2020-09-30 | 2019-09-30 |
| Income before tax | 7.64M | 7.34M | 3.98M | 2.96M | 1.85M |
| Net income | 6.03M | 5.52M | 5.06M | 3.27M | 1.85M |
| Selling general administrative | - | 6.75M | 6.26M | 6.10M | 5.88M |
| Gross profit | 21.31M | 16.67M | 12.78M | 11.80M | 9.90M |
| Reconciled depreciation | - | 0.37M | 0.43M | 0.43M | 0.45M |
| Ebit | - | 7.22M | 3.47M | 2.31M | 1.08M |
| Ebitda | 7.36M | 7.58M | 3.90M | 2.75M | 1.53M |
| Depreciation and amortization | - | 0.37M | 0.43M | 0.43M | 0.45M |
| Non operating income net other | - | 0.13M | - | 0.22M | 0.32M |
| Operating income | 7.36M | 7.22M | 3.90M | 2.75M | 1.08M |
| Other operating expenses | 40.95M | 20.53M | 19.14M | 18.85M | 16.04M |
| Interest expense | 0.39M | 0.13M | 0.51M | 0.65M | 0.77M |
| Tax provision | - | 1.82M | -1.09M | -0.31M | 0.00M |
| Interest income | - | 0.06M | 0.00M | 0.15M | 0.25M |
| Net interest income | - | 0.06M | 0.00M | 0.15M | 0.25M |
| Income tax expense | 1.61M | 1.82M | -1.09M | -0.31M | 0.00M |
| Total revenue | 48.31M | 27.74M | 23.04M | 21.60M | 17.57M |
| Total operating expenses | 13.95M | 9.46M | 8.88M | 9.06M | 8.37M |
| Cost of revenue | 26.99M | 11.07M | 10.26M | 9.79M | 7.68M |
| Total other income expense net | 0.28M | 0.13M | 0.08M | 0.22M | 0.77M |
| Net income from continuing ops | - | 5.52M | 5.06M | 3.27M | 1.85M |
| Net income applicable to common shares | - | 5.52M | 5.06M | 3.27M | 1.85M |
| Breakdown | 2023-09-30 | 2022-09-30 | 2021-09-30 | 2020-09-30 | 2019-09-30 |
|---|---|---|---|---|---|
| Type | yearly | yearly | yearly | yearly | yearly |
| Date | 2023-09-30 | 2022-09-30 | 2021-09-30 | 2020-09-30 | 2019-09-30 |
| Total assets | - | 34.71M | 27.09M | 41.55M | 38.56M |
| Intangible assets | - | 0.06M | 0.06M | 0.11M | 0.05M |
| Other current assets | - | 0.37M | 0.51M | 0.34M | 0.34M |
| Total liab | - | 3.96M | 2.50M | 13.78M | 2.35M |
| Total stockholder equity | - | 30.75M | 24.59M | 27.77M | 36.21M |
| Deferred long term liab | - | - | - | 0.13M | 0.13M |
| Other current liab | - | 2.96M | 1.42M | 12.50M | 1.11M |
| Common stock | - | 0.02M | 0.02M | 0.02M | 0.02M |
| Capital stock | - | 0.02M | 0.02M | 0.02M | 0.02M |
| Retained earnings | - | -0.36M | -5.88M | -2.34M | 5.57M |
| Other liab | - | - | 0.03M | 0.13M | 0.13M |
| Other assets | - | 0.12M | 1.25M | 0.09M | 0.10M |
| Cash | - | 17.25M | 8.27M | 12.60M | 22.42M |
| Total current liabilities | - | 3.94M | 2.47M | 13.65M | 2.22M |
| Current deferred revenue | - | 0.26M | 0.42M | 0.31M | 0.03M |
| Net debt | - | -17.22M | -8.24M | -12.56M | -22.42M |
| Short term debt | - | 0.01M | 0.01M | 0.05M | - |
| Short long term debt total | - | 0.03M | 0.03M | 0.05M | - |
| Other stockholder equity | - | 31.09M | 30.45M | 30.09M | 30.62M |
| Property plant equipment | - | 6.29M | 8.14M | 8.18M | 8.44M |
| Total current assets | - | 28.20M | 17.69M | 33.12M | 29.96M |
| Net tangible assets | - | 30.75M | 24.59M | 27.77M | 36.21M |
| Net receivables | - | 4.46M | 4.05M | 4.37M | 2.43M |
| Inventory | - | 5.35M | 4.55M | 4.29M | 4.47M |
| Accounts payable | - | 0.71M | 0.62M | 0.79M | 1.08M |
| Accumulated other comprehensive income | - | - | - | -13.24M | -12.86M |
| Common stock total equity | - | 0.02M | - | 0.02M | 0.02M |
| Retained earnings total equity | - | -0.36M | - | -2.34M | 5.57M |
| Treasury stock | - | - | - | -21.37M | -21.37M |
| Non currrent assets other | - | 0.10M | 0.19M | 0.14M | 0.10M |
| Non current assets total | - | 6.50M | 9.40M | 8.43M | 8.60M |
| Capital lease obligations | - | 0.03M | 0.04M | 0.05M | - |
| Breakdown | 2022-09-30 | 2021-09-30 | 2020-09-30 | 2019-09-30 | 2018-09-30 |
|---|---|---|---|---|---|
| Type | yearly | yearly | yearly | yearly | yearly |
| Date | 2022-09-30 | 2021-09-30 | 2020-09-30 | 2019-09-30 | 2018-09-30 |
| Investments | 2.59M | -0.34M | -0.12M | -0.08M | -2.55M |
| Change to liabilities | 1.63M | -0.06M | -0.08M | -0.77M | 0.25M |
| Total cashflows from investing activities | 2.59M | -0.34M | -0.12M | -0.08M | -2.55M |
| Total cash from financing activities | 0.30M | -19.77M | -0.71M | -0.71M | -0.71M |
| Change to operating activities | 0.96M | -0.16M | 0.08M | -0.42M | -0.01M |
| Net income | 5.52M | 5.06M | 3.27M | 1.85M | -3.65M |
| Change in cash | 8.98M | -15.52M | 1.37M | 2.03M | -4.29M |
| Begin period cash flow | 8.27M | 23.78M | 22.42M | 20.39M | 24.68M |
| End period cash flow | 17.25M | 8.27M | 23.78M | 22.42M | 20.39M |
| Total cash from operating activities | 6.09M | 4.59M | 2.19M | 2.11M | -1.74M |
| Depreciation | 0.37M | 0.43M | 0.43M | 0.45M | 0.44M |
| Other cashflows from investing activities | 2.75M | - | - | - | 0.00M |
| Dividends paid | 0.00M | 19.79M | 11.18M | - | 0.00M |
| Change to inventory | -0.71M | -0.15M | 0.11M | -0.29M | -0.10M |
| Change to account receivables | -0.25M | 0.32M | -2.02M | 1.10M | 0.23M |
| Sale purchase of stock | 0.30M | - | 0.18M | 0.00M | 0.00M |
| Other cashflows from financing activities | 2.59M | 0.02M | 11.68M | -0.08M | -2.55M |
| Change to netincome | 0.17M | -0.95M | 0.24M | 0.27M | 0.26M |
| Capital expenditures | 0.16M | 0.34M | 0.12M | 0.08M | 2.55M |
| Change receivables | -0.25M | - | -2.02M | 1.10M | 0.78M |
| Cash flows other operating | -0.63M | - | 0.23M | -0.51M | 0.29M |
| Cash and cash equivalents changes | 8.98M | - | 1.37M | 2.03M | -4.29M |
| Change in working capital | 0.04M | 0.05M | -1.76M | -0.47M | 1.21M |
| Stock based compensation | 0.34M | 0.34M | 0.18M | 0.17M | 0.20M |
| Other non cash items | -1.19M | -0.10M | 0.07M | 0.10M | 6.72M |
| Free cash flow | 5.93M | 4.25M | 2.07M | 2.03M | -4.29M |
Sector: Industrials Industry: Aerospace & Defense
|
Stock Name
|
Change
(USD) |
Price
(USD) |
Trailing
PE (x) |
Forward
PE (x) |
Price Sales
TTM (x) |
Price to Book Value (x)
|
Enterprise Value
to Revenue (x) |
Enterprise Value
to EBITDA (x) |
|---|---|---|---|---|---|---|---|---|
| SPCX Space Exploration Technologies Corp. Class A Common Stock |
-2.70 1.89% |
140.39 | - | 200.00 | 82.08 | 15.35 | 82.13 | 500.95 |
| GE GE Aerospace |
1.76 0.52% |
339.67 | 37.45 | 35.09 | 6.29 | 18.68 | 6.70 | 27.10 |
| EADSF Airbus Group SE |
2.68 1.14% |
237.20 | 25.70 | 22.32 | 2.30 | 5.91 | 1.97 | 13.60 |
| BA The Boeing Company |
0.47 0.27% |
173.85 | 88.37 | 153.85 | 1.93 | 31.61 | 2.21 | 26.81 |
Innovative Solutions and Support, Inc., a systems integrator, designs, develops, manufactures, sells, and services flight guidance, autothrottles, and cockpit display systems in the United States and internationally. It offers flat panel display systems that replicate the display of analog or digital displays on one screen and replace existing displays in legacy aircraft, as well as used for security monitoring on-board aircraft and as tactical workstations on military aircraft; and flight deck management system, a navigation and performance computer that upgrade for commercial air transport aircraft. The company also provides integrated standby units, which incorporate the measurement and display of attitude, altitude, airspeed, and navigation data into a single backup navigation instrument for military, commercial air transport, and corporate/general aviation applications. In addition, it offers digital air data computers that calculate various air data parameters, such as altitude, airspeed, vertical speed, angle of attack, and other information; integrated air data computers and display units, which calculate and convey air data information; altitude displays that convey aircraft altitude measurements; airspeed displays that convey various airspeed measurements; and altitude alerters. Further, the company offers the engine and fuel displays that convey information related to fuel and oil levels, and engine activity, including oil and hydraulic pressure and temperature; integrated global navigation systems; ThrustSense, a full regime autothrottle; and utility management systems. It serves commercial air transport carriers and corporate/general aviation companies, the Department of Defense and its commercial contractors, aircraft operators, aircraft modification centers, government agencies, and foreign militaries, as well as original equipment manufacturers. Innovative Solutions and Support, Inc. was incorporated in 1988 and is based in Exton, Pennsylvania.

720 Pennsylvania Drive, Exton, PA, United States, 19341-1129

610 646 9800

95
| Name | Title | Year Born |
|---|---|---|
| Dr. Shahram Askarpour | Pres, CEO & Director | 1957 |
| Mr. Michael Linacre | Chief Financial Officer | NA |
| Dr. Shahram Askarpour | President, CEO & Director | 1957 |
| Mr. Jeffrey DiGiovanni | Chief Financial Officer | 1977 |
Disclaimer - (*)This information, including any data, is sourced from Unicorn Data Services SAS, trading as EOD Historical Data (“EODHD”) on an ‘as is’ basis, using their API. We cannot guarantee the completeness or validity of the information and data provided on this page, as well as via the API. In some cases, the data may include analyst ratings or recommendations sourced through the EODHD API, which are intended solely for general information purposes.
This information does not consider your personal objectives, financial situation, or needs. Kalkine is not liable for any errors or omissions in the information provided or for any actions taken in reliance on it. You should seek advice from a financial adviser, stockbroker or other professional adviser (including taxation and legal advice) as necessary before acting on this information.

Download a free report with stock ideas and industry insights for general information.
Download Free Report Now →


Basic Materials
 +0.06%
Communication Services
+0.16%

Consumer Cyclical
 -0.27%

Consumer Defensive
-0.26%

Energy
+1.15%

Financial Services
+0.01%
Financials
-0.13%

Healthcare
+0.15%

Industrials
+0.31%

Real Estate
-0.28%

Technology
+1.73%

Utilities
-0.24%
Note: Daily price change (%) by sector excluding stocks with +/-90% daily price change. Companies above $500 million market capitalization are considered.
 Portfolio
 Watchlist


 Please wait processing your request...