Tilray Brands Inc
Tilray Brands, Inc. (NASDAQ: TLRY) is a global cannabis-lifestyle and consumer packaged goods company. The Company operates through four segments: Cannabis business, Distribution business, Beverage alcohol business and Wellness business.
Recent Business and Financial Updates
- Financial Highlights – 2024 Fiscal Fourth Quarter
- Net Revenue: In the fourth quarter, net revenue increased by 25% to USD 229.9 million, compared to USD 184.2 million in the same period of the previous year.
- Gross Profit: Gross profit for the fourth quarter was USD 82.4 million, up from USD 67.2 million in the prior year quarter. Both gross margin and adjusted gross margin were 36%.
- Beverage-Alcohol Segment: Net revenue in the beverage-alcohol segment surged by 137% to USD 76.7 million from USD 32.4 million in the prior year quarter, driven by new product innovations and contributions from the Craft Acquisition brands. Gross profit in this segment increased by 146% to USD 40.8 million from USD 16.6 million, while adjusted gross profit rose by 130% to USD 41.0 million from USD 17.8 million. The gross margin in the beverage-alcohol segment improved to 53% from 51%, with the adjusted gross margin at 53%, compared to 55% in the previous year quarter.
- Cannabis Segment: Net revenue in the cannabis segment increased by 12% to USD 71.9 million from USD 64.4 million in the prior year quarter, partly due to the acquisitions of HEXO and Truss. However, gross profit and adjusted gross profit in this segment decreased to USD 28.8 million from USD 39.5 million in the prior year quarter. The gross margin and adjusted gross margin for the cannabis segment were 40%, down from 61%, primarily due to the completion of the HEXO advisory services agreement in Q1 fiscal 2024.
- Distribution Segment: Net revenue in the distribution segment was USD 65.6 million, down from USD 72.6 million in the prior year quarter. This decrease reflects management's strategy to discontinue less profitable product lines, resulting in an increased gross margin of 12% compared to 9% in the previous year quarter.
- Wellness Segment: Net revenue in the wellness segment increased by 6% to USD 15.7 million from USD 14.8 million in the prior year quarter.
- Net Loss: The net loss for the fourth quarter narrowed significantly to USD (15.4) million, compared to a net loss of USD (119.8) million in the prior year quarter, mainly due to non-cash expenses. Adjusted net income was USD 35.1 million, compared to a loss of USD (11.8) million in the prior year quarter. Net loss per share improved to USD (0.04) from USD (0.15) in the prior year quarter. Adjusted net income (loss) per share was USD 0.04, compared to a loss of USD (0.02) in the prior year quarter.
- Adjusted EBITDA: Adjusted EBITDA for the fourth quarter increased by 37% to USD 29.5 million, compared to USD 21.5 million in the prior year quarter.
- Financial Highlights – 2024 Fiscal Year
- Net Revenue: Net revenue for fiscal 2024 increased by 26% to USD 788.9 million, compared to USD 627.1 million in the prior fiscal year.
- Gross Profit: Gross profit for fiscal 2024 was USD 223.4 million, while adjusted gross profit increased by 14% to USD 235.6 million. The gross margin was 28%, with an adjusted gross margin of 30%.
- Beverage-Alcohol Segment: Net revenue in the beverage-alcohol segment increased by 113% to USD 202.1 million from USD 95.1 million in the prior fiscal year. Gross profit in this segment increased by 91% to USD 88.6 million from USD 46.3 million, while adjusted gross profit rose to USD 93.2 million from USD 50.8 million. The gross margin for the beverage-alcohol segment was 44%, down from 49% in the prior fiscal year, with the adjusted gross margin at 46%, compared to 53% in the previous year.
- Cannabis Segment: Net revenue in the cannabis segment increased by 24% to USD 272.8 million from USD 220.4 million in the prior fiscal year, driven by the acquisitions of HEXO and Truss, along with international market growth. Gross profit in this segment increased to USD 90.2 million from USD 57.7 million, while adjusted gross profit was USD 97.8 million, compared to USD 112.7 million, due to the conclusion of the advisory service agreement in Q1 fiscal 2024. The gross margin for the cannabis segment was 33%, up from 26%, while the adjusted gross margin was 36%, compared to 51% in the previous year.
- Distribution Segment: Net revenue and gross margin in the distribution segment remained consistent at approximately USD 259 million and 11%, respectively, in fiscal 2024 compared to the prior fiscal year.
- Wellness Segment: Net revenue in the wellness segment increased by 5% to USD 55.3 million from USD 52.8 million in the prior fiscal year. The gross margin for this segment was 30%, compared to 29% in the previous year.
- Net Loss: The net loss for fiscal 2024 decreased significantly to USD (222.4) million, compared to a net loss of USD (1.4) billion in the prior fiscal year, primarily due to non-cash expenses. Net loss per share improved to USD (0.33) from USD (2.35) in the prior fiscal year. Adjusted net income increased to USD 6.2 million from USD 0.4 million in the prior fiscal year. Adjusted net income per share was USD 0.01, compared to USD 0.00 in the previous year.
- Adjusted EBITDA: Adjusted EBITDA increased to USD 60.5 million in fiscal 2024, up from USD 58.7 million in the prior fiscal year.
- Financial Liquidity: The company maintained a strong financial liquidity position of approximately USD 260.5 million, comprising USD 228.3 million in cash and USD 32.2 million in marketable securities. The outstanding principal of the net convertible debt was reduced by USD 291.0 million compared to the previous fiscal year.
- Cash Flow: Net cash used in operating activities was USD (30.9) million in fiscal 2024, compared to USD 7.9 million net cash from operating activities in the previous year. Adjusted free cash flow was USD 6.6 million, compared to USD 19.1 million in the prior year.
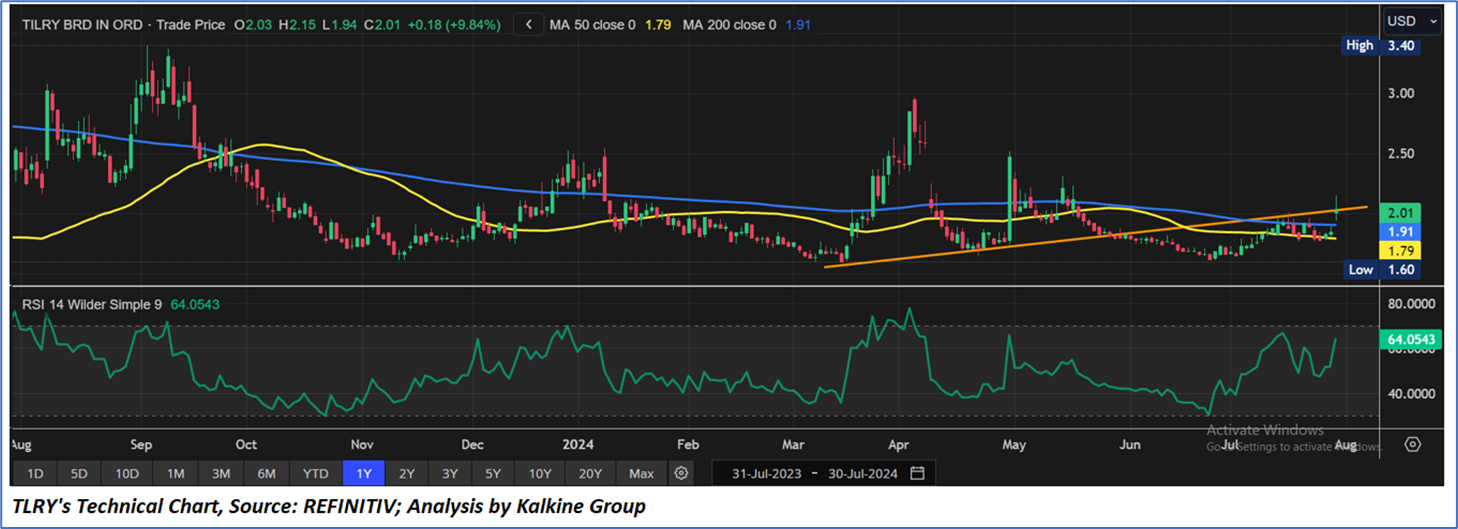
Technical Observation (on the daily chart):
The Relative Strength Index (RSI) over a 14-day period stands at a value of 64.05, upward trending with expectations of an upward momentum in case the price breaks important resistance zone of USD 2.00-USD 2.20. Additionally, the stock's current positioning is above both 50-Day SMA and 200-Day SMA, which can act as a short to medium term support levels.
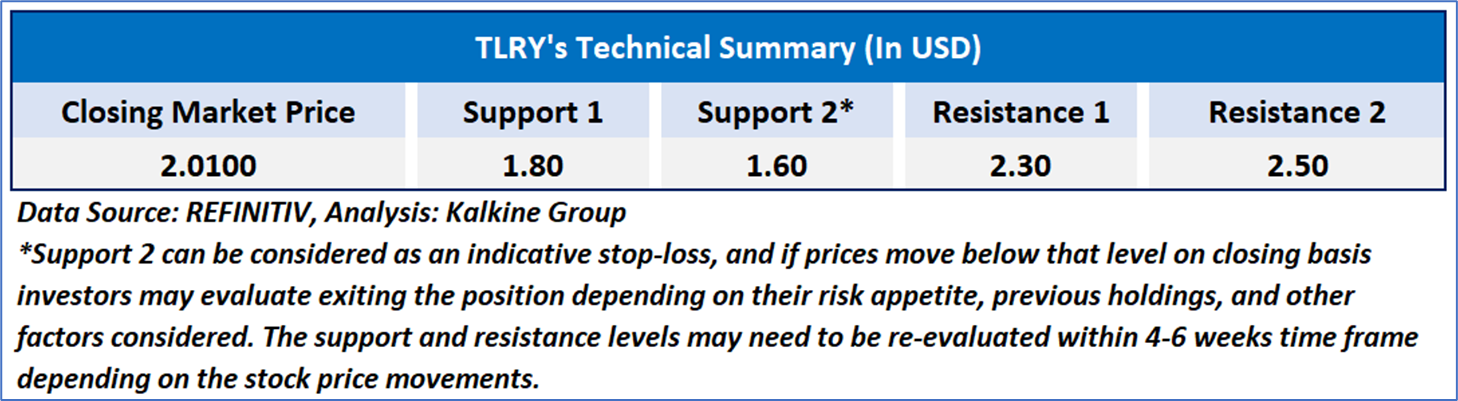
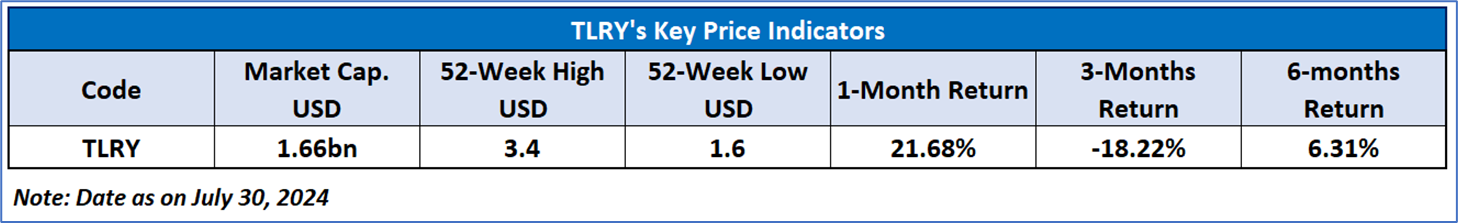
As per the above-mentioned price action, recent key business and financial updates, momentum in the stock over the last month, and technical indicators analysis, a ‘Watch’ rating has been given to Tilray Brands, Inc. (NASDAQ: TLRY) at the closing market price of USD 2.01 as of July 30, 2024.
Individuals can evaluate the stock based on the support and resistance levels provided in the report in case of keen interest taking into consideration the risk-reward scenario.
Markets are trading in a highly volatile zone currently due to certain macro-economic issues and prevailing geopolitical tensions. Therefore, it is prudent to follow a cautious approach while investing.
Related Risk: This report may be looked at from a high-risk perspective and a recommendation is provided for a short duration. This report is solely based on technical parameters, and the fundamental performance of the stocks has not been considered in the decision-making process. Other factors which could impact the stock prices include market risks, regulatory risks, interest rates risks, currency risks, social and political instability risks etc.
Note 1: Past performance is not a reliable indicator of future performance.
Note 2: The reference date for all price data, currency, technical indicators, support, and resistance level is July 30, 2024. The reference data in this report has been partly sourced from REFINITIV.
Note 3: Investment decisions should be made depending on an individual's appetite for upside potential, risks, holding duration, and any previous holdings. An 'Exit' from the stock can be considered if the Target Price mentioned as per the Valuation and or the technical levels provided has been achieved and is subject to the factors discussed above.
Note 4: Target Price refers to a price level that the stock is expected to reach as per the relative valuation method and or technical analysis taking into consideration both short-term and long-term scenarios.s
Note 5: ‘Kalkine reports are prepared based on the stock prices captured either from the New York Stock Exchange (NYSE), NASDAQ Capital Markets (NASDAQ), and or REFINITIV. Typically, all sources (NYSE, NASDAQ, or REFINITIV) may reflect stock prices with a delay which could be a lag of 15-20 minutes. There can be no assurance that future results or events will be consistent with the information provided in the report. The information is subject to change without any prior notice.

 Please wait processing your request...