
Tradr 2X Long ACHR Daily ETF
The Fund aims daily investment results, that correspond to two times (200%) the daily performance of the common shares of Archer Aviation Inc. Under normal market circumstances, the Fund will maintain at least 80% exposure to financial instruments that provide two times leveraged exposure to the daily performance of ACHR.
Its performance over extended periods diverges from the expected 200% due to the compounding effect of daily returns, which is influenced by factors like holding duration and stock volatility. High volatility amplifies the impact of compounding, potentially leading to significant deviations from the underlying stock’s performance. Consequently, this ETF is designed for short-term trading rather than buy-and-hold strategies.
Underlying Stock: Archer Aviation Inc (NYSE: ACHR)
Archer Aviation Inc. is an aerospace company. It is engaged in providing customers with advanced aircraft and related technologies and services in the United States and internationally in both the commercial and defense sectors. Its commercial line of business consists of the sale of its commercial aircraft (Archer Direct), such as Midnight, to aircraft operators as well as technologies and services related thereto, including commercial launch (certification, testing, training, demonstration, market survey and early trial operations), and maintenance and repair.
Technical Analysis on ETF and Underlying Asset
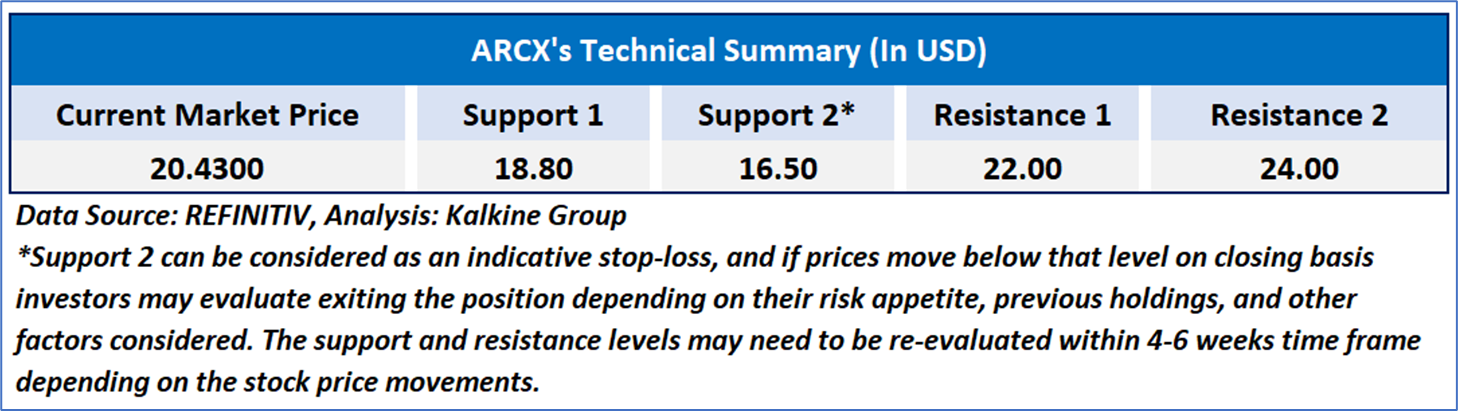
NASDAQ: ARCX
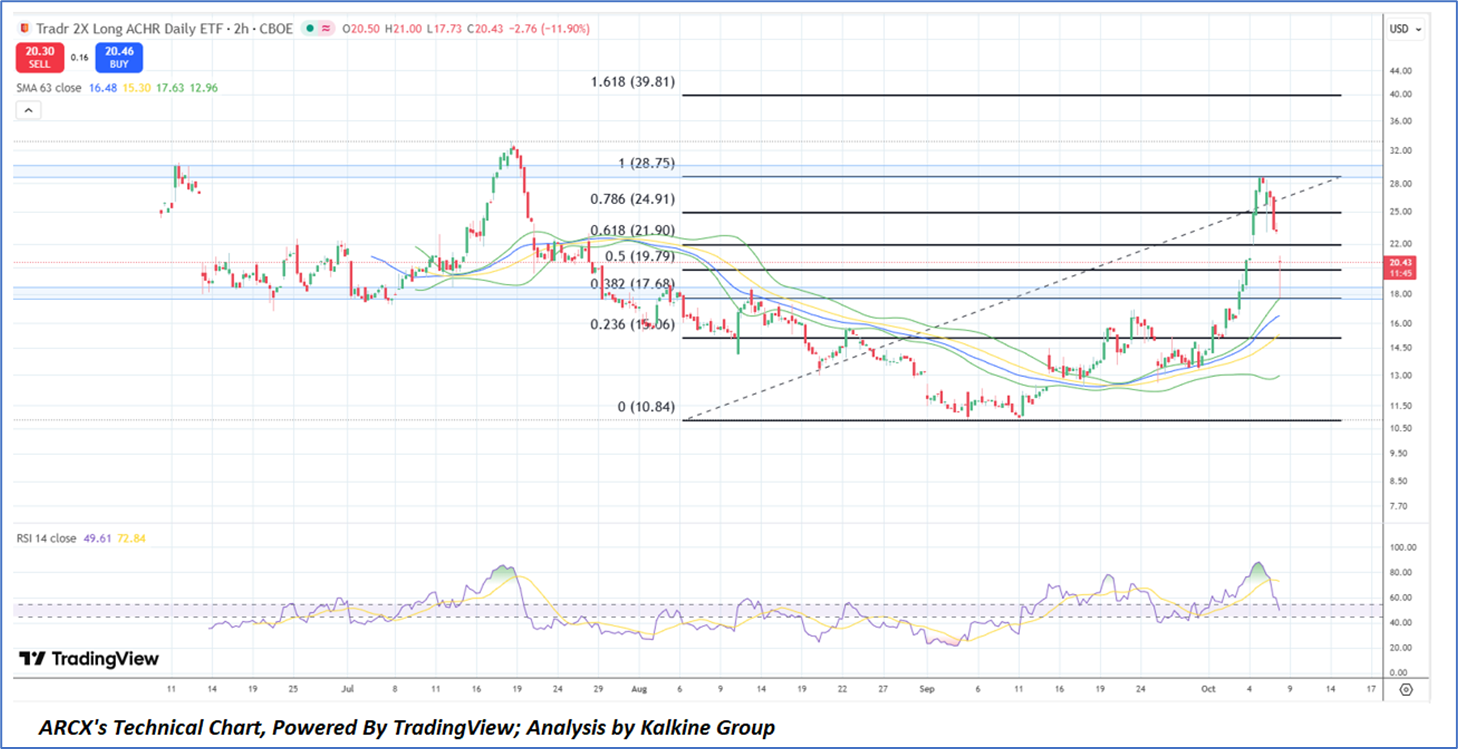
Overall, ARCX remains in a medium-term bullish trend, but the short-term outlook suggests consolidation as the market digests recent gains. The zone between USD 19.8 and USD 21.0 forms a crucial support band where traders may look for price stabilization before potential upward continuation. Resistance exists around USD 25 and USD 28.75, which must be breached to confirm renewed bullish strength. The technical setup implies that maintaining price action above the 0.5 Fibonacci level could lead to a rebound toward upper resistance zones, while failure to hold may lead to a test of lower retracement levels around USD 17.7 or USD 15.0. In conclusion, the ETF is exhibiting a healthy correction within an overall uptrend, with near-term movements likely guided by RSI stabilization and price behavior around the key retracement supports.
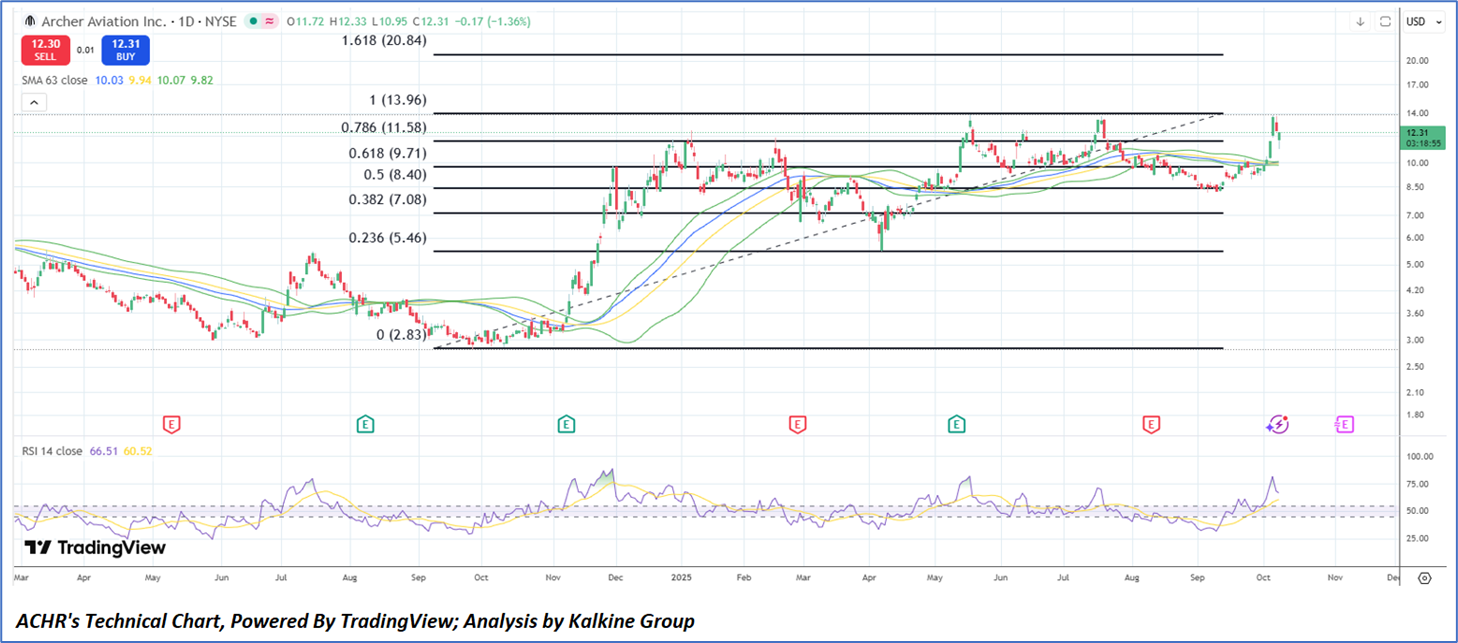
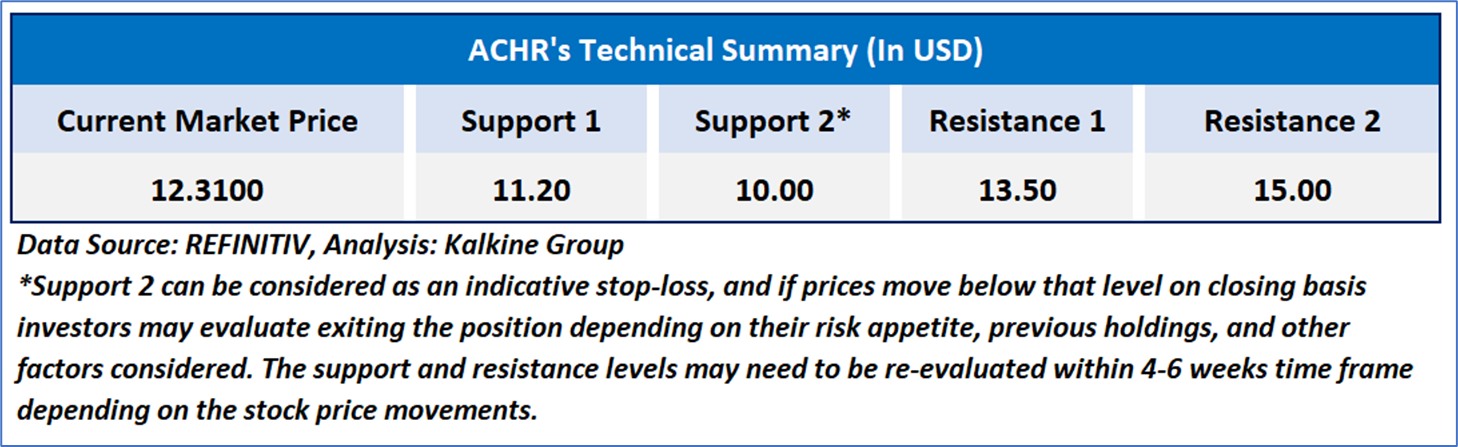
Underlying Asset Analysis: NYSE: ACHR
Overall, the technical setup for ACHR suggests a resumption of the broader uptrend following a prolonged consolidation period. The breakout above the USD 11.50–12.00 zone, previously a strong resistance, now acts as a critical support base. If the stock sustains above USD 12.00, bullish traders may target USD 13.92 (recent high) and subsequently USD 15.50–20.80 (Fibonacci extension) levels. A corrective move below USD 11.50 could lead to a mild retracement toward USD 9.70 (0.618), where renewed buying interest may emerge. The overall pattern demonstrates bullish accumulation, supported by the moving average alignment and healthy RSI behavior. In summary, Archer Aviation’s price structure points toward continued upward potential, with USD 11.50–12.00 as a near-term accumulation zone and USD 14.00–20.80 as medium-term bullish targets, provided momentum sustains above the key moving average thresholds.
Note 1: Past performance is not a reliable indicator of future performance.
Note 2: The reference date for all price data, currency, technical indicators, support, and resistance level is October 08, 2025. The reference data in this report has been partly sourced from REFINITIV.
Note 3: Investment decisions should be made depending on an individual's appetite for upside potential, risks, holding duration, and any previous holdings.
Note 4: ‘StockNextt reports are prepared based on the prices captured either from the New York Stock Exchange (NYSE), NASDAQ Capital Markets (NASDAQ), and or REFINITIV. Typically, all sources (NYSE, NASDAQ, or REFINITIV) may reflect stock prices with a delay which could be a lag of 15-20 minutes. There can be no assurance that future results or events will be consistent with the information provided in the report. The information is subject to change without any prior notice.
Kalkine Equities LLC, with Delaware File Number 4697384, Foreign Qualification Registration in California File Number 202109211078, and Texas File Number 805521396, is authorized to provide general advice only. The information on https://kalkine.com/ does not take into account any of your investment objectives, financial situation or needs. You should consider the appropriateness of advice taking into account your own objectives, financial situation and needs and seek independent financial advice before making any financial decisions. The link to our Terms and Conditions and Privacy Policy has been provided for your reference. On the date of publishing the reports (mentioned on the website), employees and/or associates of Kalkine do not hold positions in any of the stocks covered on the website. These stocks can change any time and readers of the reports should not consider these stocks as advice or recommendations later.
Past performance is not a reliable indicator of future performance.
 Please wait processing your request...