
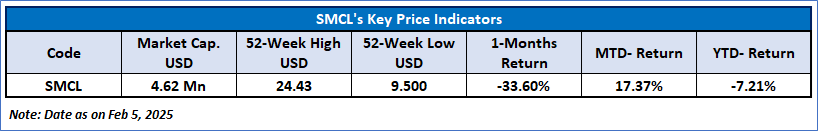
Graniteshares 2X Long SMCI Daily ETF
The Fund seeks daily investment results of 2 times the daily percentage change of the common stock of Super Micro Computer Inc. It is an actively managed exchange traded fund that attempts to replicate 2 times the daily percentage change of the Underlying Stock by entering into swap agreement on the Underlying Stock.
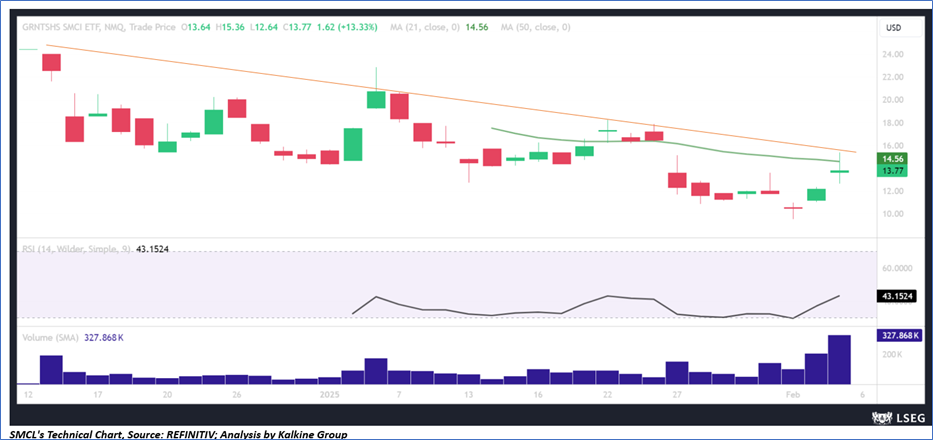
Technical Observation (on the daily chart):
The price of SMCL appears to be following a descending trendline, characterized by lower highs and lower lows, indicating a persistent downtrend. It is advisable to wait for a change in this structure before initiating long positions. The ongoing downtrend might signal a short-term consolidation period with a negative inclination. The 14-day Relative Strength Index (RSI), which measures momentum, remains below the midpoint, reinforcing the negative sentiment. Additionally, it is crucial to note that the ETF is currently positioned below both its 21-day Simple Moving Average (SMA), suggesting this level could potentially act as temporary resistance points in the near future.
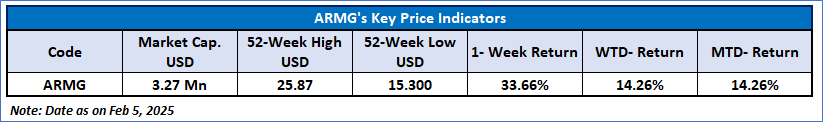
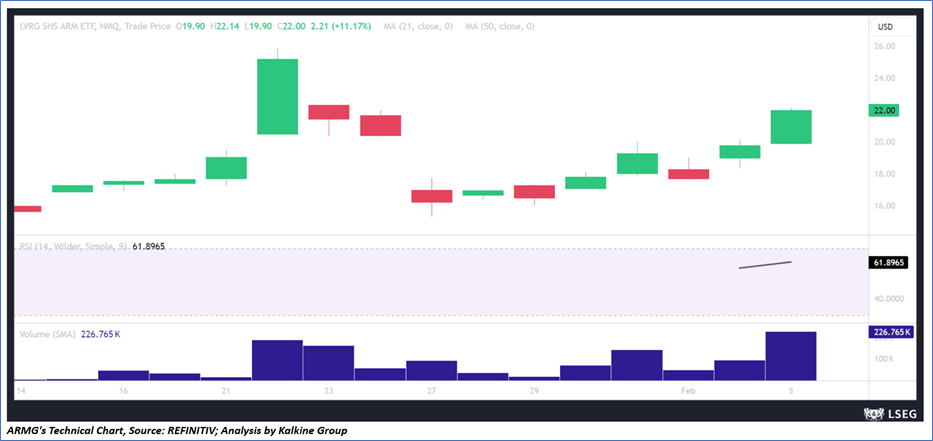
Leverage Shares 2X Long ARM Daily ETF
The Fund seeks daily leveraged investment results and is very different from most other exchange-traded funds. The fund is an exchange traded fund that seeks daily levered investment results, before fees and expenses, of two times (200%) of the daily percentage change in the price of the common stock of ARM.
Technical Observation (on the daily chart):
The price of ARMG has found support at key levels and is beginning to rise, suggesting the potential for continued upward momentum in the near future. Key support and resistance levels are likely to serve as potential demand and supply zones. Additionally, the 14-day Relative Strength Index (RSI), which gauges momentum, is above the midpoint, further supporting the positive sentiment.
Markets are trading in a highly volatile zone currently due to certain macro-economic issues and prevailing geopolitical tensions. Therefore, it is prudent to follow a cautious approach while investing.
Related Risk: This report may be looked at from a high-risk perspective and a recommendation is provided for a short duration. This report is solely based on technical parameters, and the fundamental performance of the ETFs has not been considered in the decision-making process. Other factors which could impact the ETF prices include market risks, regulatory risks, interest rates risks, currency risks, social and political instability risks etc.
Technical Indicators Defined: -
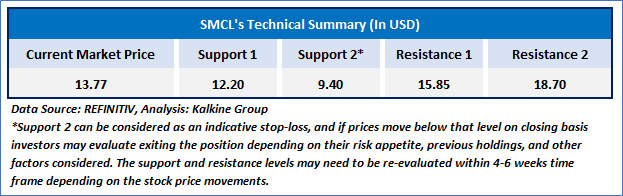
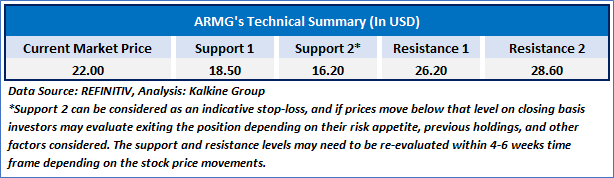
Support: A level at which the ETF prices tend to find support if they are falling, and a downtrend may take a pause backed by demand or buying interest. Support 1 refers to the nearby support level for the ETF and if the price breaches the level, then Support 2 may act as the crucial support level for the ETF.
Resistance: A level at which the ETF prices tend to find resistance when they are rising, and an uptrend may take a pause due to profit booking or selling interest. Resistance 1 refers to the nearby resistance level for the ETF and if the price surpasses the level, then Resistance 2 may act as the crucial resistance level for the ETF.
Stop-loss: It is a level to protect further losses in case of unfavourable movement in the ETF prices.
Past performance is neither an indicator nor a guarantee of future performance.
The reference date for all price data, currency, technical indicators, support, and resistance levels is Feb 5, 2025 (11:40 am EST). The reference data in this report has been partly sourced from REFINITIV.
Abbreviations
CMP: Current Market Price
SMA: Simple Moving Average
RSI: Relative Strength Index
USD: United States dollar
Note: Trading decisions require a thorough analysis by individual. Technical reports in general chart out metrics that may be assessed by individuals before any ETF evaluation. The above are illustrative analytical factors used for evaluating ETFs; other parameters can be looked at along with additional risks per se. Past performance is neither an indicator nor a guarantee of future performance.
Kalkine Equities LLC, with Delaware File Number 4697384, Foreign Qualification Registration in California File Number 202109211078, and Texas File Number 805521396, is authorized to provide general advice only. The information on https://kalkine.com/ does not take into account any of your investment objectives, financial situation or needs. You should consider the appropriateness of advice taking into account your own objectives, financial situation and needs and seek independent financial advice before making any financial decisions. The link to our Terms and Conditions and Privacy Policy has been provided for your reference. On the date of publishing the reports (mentioned on the website), employees and/or associates of Kalkine do not hold positions in any of the stocks covered on the website. These stocks can change any time and readers of the reports should not consider these stocks as advice or recommendations later.
Past performance is not a reliable indicator of future performance.
 Please wait processing your request...