
Global Commodity Market Wrap-Up
Last week, the metals market exhibited a pronounced mixed trend. Gold demonstrated resilience with a modest gain of 0.45%, whereas silver declined by -2.83%. Base metals saw varied movements: copper fell by -2.21%, zinc rose by 3.43%, and lead increased by 0.65%. This diverse performance marks a sharp contrast to the stability of the previous week, indicating a shift towards more bullish sentiment.
Last week, Natural Gas prices rebounded sharply, achieving a robust gain of 8.95%. This recovery indicates a change in market sentiment, likely due to shifts in supply dynamics or seasonal demand factors. In contrast, Crude Oil prices also saw a significant rise of 4.16%, reflecting improved market confidence. Additionally, US Sugar experienced an increase of 2.10%, which contributed to the varied performance in agricultural commodities.
The upcoming Micro and Macroeconomic events that may impact market sentiments include an update on FOMC Meeting Minutes, Initial Jobless Claims, Existing Home Sales and Building Permits.
Having reviewed the global commodities performance over the past week, considered major economic events, and conducted technical analysis on these three commodities US wheat, Corn and US Sugar.
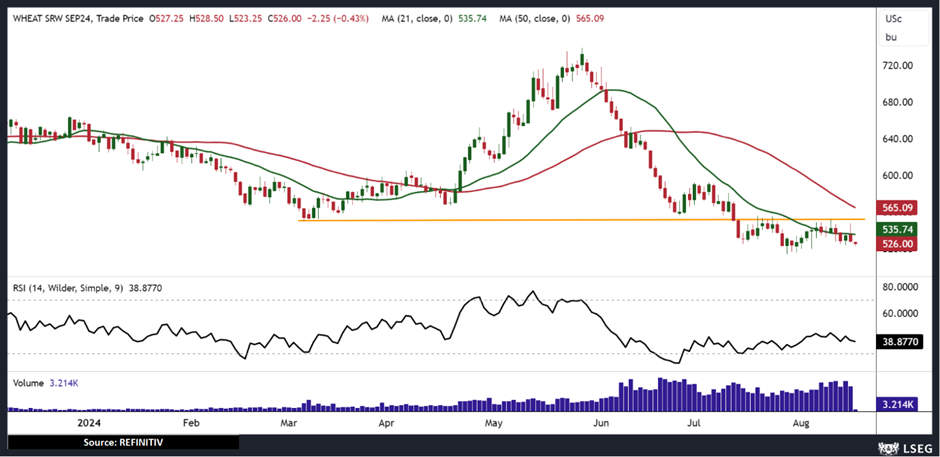
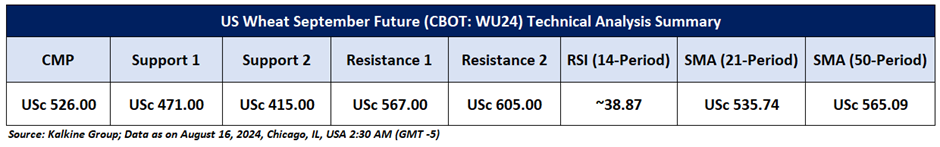
US Wheat September Future (CBOT: WU24)
Technical Observation (on the Daily chart):
Wheat futures show bearish potential as September prices stay below crucial support levels. The daily chart features a red candle under this support, indicating further declines may be ahead. The 14-period RSI at 38.87 supports this bearish view. Additionally, the price is below the 21-period and 50-period SMAs, which act as resistance. Despite the negative short-term trend, investors should stay alert to possible continued downward pressure.
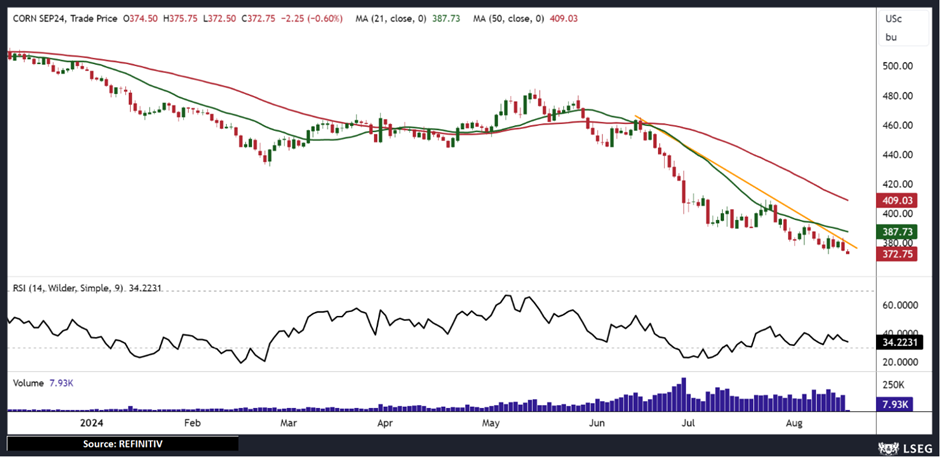
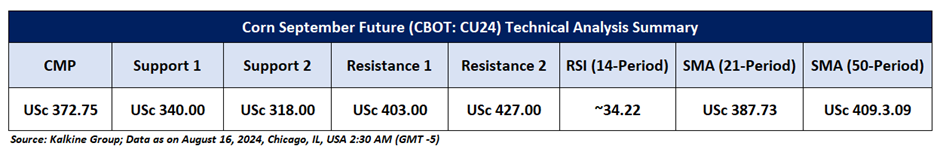
Corn September Future (CBOT: CU24)
Technical Observation (on the Daily chart):
Corn futures display bearish potential as September prices remain below key support levels and trendlines. The daily chart shows a red candle under this support, suggesting further declines. The 14-period RSI at 34.22, coupled with bearish divergence, reinforces the negative outlook. Additionally, the price is below the 21-period and 50-period SMAs, which act as resistance. Despite the current downtrend, investors should stay vigilant for ongoing downward pressure.
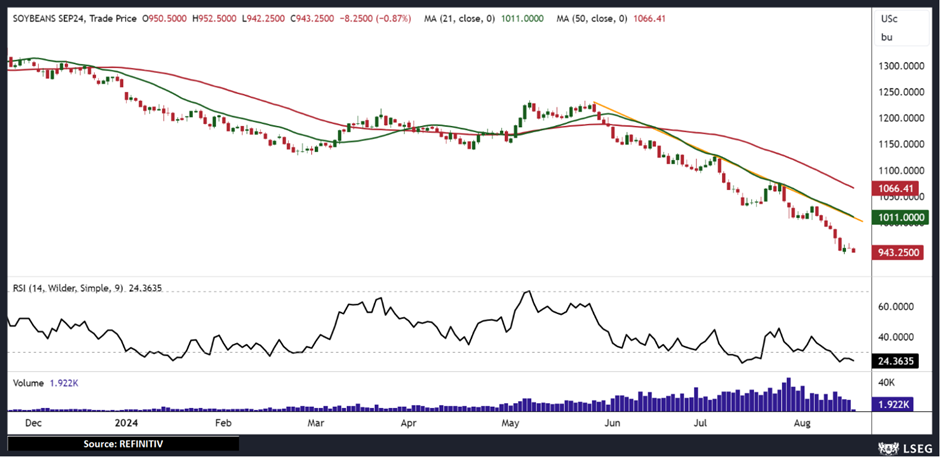
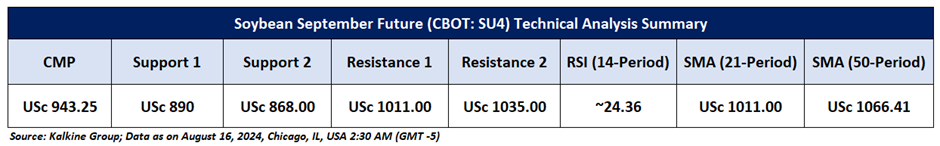
US Soybeans September Future (CBOT: SU24)
Technical Observation (on the Daily chart):
US soybean futures show bearish potential as September prices stay below key support levels and trendlines. A red candle on the daily chart beneath this support, along with a descending pattern, suggests further declines. The 14-period RSI at 24.36, remaining in the oversold zone, reinforces the negative outlook. Additionally, prices are below the 21-period and 50-period SMAs, which act as resistance. Investors should remain cautious and alert for continued downward pressure despite the ongoing downtrend.
Markets are trading in a highly volatile zone currently due to certain macro-economic issues and prevailing geopolitical tensions. Therefore, it is prudent to follow a cautious approach while investing.
Related Risk: This report may be looked at from a high-risk perspective and a recommendation is provided for a short duration. This report is solely based on technical parameters, and the fundamental performance of the stocks has not been considered in the decision-making process. Other factors which could impact the stock prices include market risks, regulatory risks, interest rates risks, currency risks, social and political instability risks etc.
How to Read the Charts?
The yellow colour line reflects the 21-period simple moving average (SMA) while the blue line indicates the 50- period simple moving average (SMA). SMA helps to identify existing price trends. If the prices are trading above the 21-period and 50-period moving average, then it shows prices are currently trading in a bullish trend.
The orange colour line in the chart’s lower segment reflects the Relative Strength Index (14-Period) which indicates price momentum and signals momentum in trend. A reading of 70 or above suggests overbought status while a reading of 30 or below suggests an oversold status.
The red and green colour bars in the chart’s lower segment show the volume of the stock. The volume is the number of shares that changed hands during a given day. Stocks with high volumes are more liquid than stocks with lesser volume as liquidity in stocks helps with easier and faster execution of the order.
The Orange colour lines are the trend lines drawn by connecting two or more price points and used for trend identification purposes. The trend line also acts as a line of support and resistance.
Technical Indicators Defined: -
Support: A level at which the stock prices tend to find support if they are falling, and a downtrend may take a pause backed by demand or buying interest. Support 1 refers to the nearby support level for the stock and if the price breaches the level, then Support 2 may act as the crucial support level for the stock.
Resistance: A level at which the stock prices tend to find resistance when they are rising, and an uptrend may take a pause due to profit booking or selling interest. Resistance 1 refers to the nearby resistance level for the stock and if the price surpasses the level, then Resistance 2 may act as the crucial resistance level for the stock.
Stop-loss: It is a level to protect further losses in case of unfavourable movement in the stock prices.
The reference date for all price data, currency, technical indicators, support, and resistance levels at (2:30 AM, GMT-5,) of August 16, 2024. The reference data in this report has been partly sourced from REFINITIV.
Abbreviations
CMP: Current Market Price
SMA: Simple Moving Average
RSI: Relative Strength Index
CAD: Canadian dollar
Note: Trading decisions require a thorough analysis by individual. Technical reports in general chart out metrics that may be assessed by individuals before any stock evaluation. The above are illustrative analytical factors used for evaluating stocks; other parameters can be looked at along with additional risks per se. Past performance is neither an indicator nor a guarantee of future performance.
Kalkine Equities LLC, with Delaware File Number 4697384, Foreign Qualification Registration in California File Number 202109211078, and Texas File Number 805521396, is authorized to provide general advice only. The information on https://kalkine.com/ does not take into account any of your investment objectives, financial situation or needs. You should consider the appropriateness of advice taking into account your own objectives, financial situation and needs and seek independent financial advice before making any financial decisions. The link to our Terms and Conditions and Privacy Policy has been provided for your reference. On the date of publishing the reports (mentioned on the website), employees and/or associates of Kalkine do not hold positions in any of the stocks covered on the website. These stocks can change any time and readers of the reports should not consider these stocks as advice or recommendations later.
Copyright © 2024 Krish Capital Pty Ltd. All rights reserved.
Past performance is not a reliable indicator of future performance.
 Please wait processing your request...