
Company Overview: Versus Systems Inc., (NASDAQ: VS) based in Los Angeles, California, provides a platform that integrates into mobile, console, and PC games, as well as streaming media and apps. This Report covers the Price Action, Technical Indicators Analysis along with the Support Levels, Resistance Levels, and Recommendations on these stocks.
Latest Update: On October 16, 2024, Versus Systems, Inc. announced two key agreements with Aspis Cyber Technologies, Inc. (ASPIS), a cloud-based mobile cybersecurity firm. The first agreement involves a $2.5 million investment, with ASPIS initially contributing $500,000 and the remaining $2 million due by November 2024. The second agreement grants ASPIS a license to integrate Versus Systems' gamification and QR code technology into its cybersecurity offerings across various sectors, in exchange for a monthly fee. These agreements are part of Versus Systems' plan to meet Nasdaq's shareholder equity requirements for continued listing on the Nasdaq Capital Market.
Financial Update: For the three months ending September 30, 2024, revenue was $3,848, a decrease of 83%, compared to $22,950 for the same period in 2023. This decline was largely due to a significant reduction in the number of clients from September 2023 to September 2024. The loss from operations for the three months ending September 30, 2024, was $529,024, a decrease of 72%, from $1,889,892 for the same period in 2023. This reduction was primarily driven by lower spending on professional fees and payroll.
VS Technical Analysis: On the daily chart, VS prices are trading below the upward trendline resistance zone. Moreover, the momentum oscillator RSI (14-period) is showing a reading of ~49.90 level. Further, the prices are trading above the trend-following indicator 21-period SMA, which may act as a support level. An important support level for the stock is placed at USD 1.29, while the key resistance level is placed at USD 2.24.
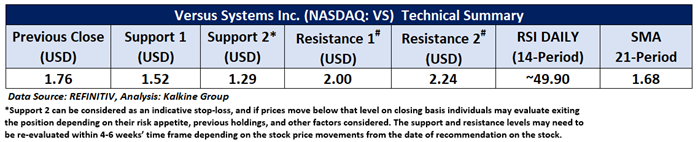
Daily Technical Chart – VS
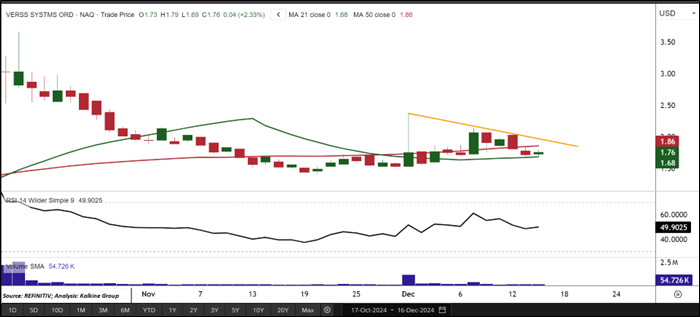
Considering the stock’s current trading below the upward trendline, and momentum oscillator analysis, a “Watch” recommendation is given on the stock. The stock was analysed as per the closing price of USD 1.76 per share as on 16 December 2024, up by 2.33%.
Individuals can evaluate the stock based on the support and resistance levels provided in the report in case of keen interest, taking into consideration the risk-reward scenario.
Markets are trading in a highly volatile zone currently due to certain macro-economic issues and prevailing geopolitical tensions. Therefore, it is prudent to follow a cautious approach while investing.
Related Risk: This report may be looked at from a high-risk perspective and a recommendation is provided for a short duration. This report is solely based on technical parameters, and the fundamental performance of the stocks has not been considered in the decision-making process. Other factors which could impact the stock prices include market risks, regulatory risks, interest rates risks, currency risks, social and political instability risks etc.
Note 1: Past performance is not a reliable indicator of future performance.
Note 2: The reference date for all price data, currency, technical indicators, support, and resistance level is December 16, 2024. The reference data in this report has been partly sourced from REFINITIV.
Note 3: Investment decisions should be made depending on an individual's appetite for upside potential, risks, holding duration, and any previous holdings. An 'Exit' from the stock can be considered if the Target Price mentioned as per the Valuation and or the technical levels provided has been achieved and is subject to the factors discussed above.
Note 4: Target Price refers to a price level that the stock is expected to reach as per the relative valuation method and or technical analysis taking into consideration both short-term and long-term scenarios.
Note 5: ‘Kalkine reports are prepared based on the stock prices captured either from the New York Stock Exchange (NYSE), NASDAQ Capital Markets (NASDAQ), and or REFINITIV. Typically, all sources (NYSE, NASDAQ, or REFINITIV) may reflect stock prices with a delay which could be a lag of 15-20 minutes. There can be no assurance that future results or events will be consistent with the information provided in the report. The information is subject to change without any prior notice.
Technical Indicators Defined:
Support: A level at which the stock prices tend to find support if they are falling, and a downtrend may take a pause backed by demand or buying interest. Support 1 refers to the nearby support level for the stock and if the price breaches the level, then Support 2 may act as the crucial support level for the stock.
Resistance: A level at which the stock prices tend to find resistance when they are rising, and an uptrend may take a pause due to profit booking or selling interest. Resistance 1 refers to the nearby resistance level for the stock and if the price surpasses the level, then Resistance 2 may act as the crucial resistance level for the stock.
Stop-loss: It is a level to protect further losses in case of unfavourable movement in the stock prices.
Kalkine Equities LLC, with Delaware File Number 4697384, Foreign Qualification Registration in California File Number 202109211078, and Texas File Number 805521396, is authorized to provide general advice only. The information on https://kalkine.com/ does not take into account any of your investment objectives, financial situation or needs. You should consider the appropriateness of advice taking into account your own objectives, financial situation and needs and seek independent financial advice before making any financial decisions. The link to our Terms and Conditions and Privacy Policy has been provided for your reference. On the date of publishing the reports (mentioned on the website), employees and/or associates of Kalkine do not hold positions in any of the stocks covered on the website. These stocks can change any time and readers of the reports should not consider these stocks as advice or recommendations later.
Copyright © 2024 Krish Capital Pty Ltd. All rights reserved.
Past performance is not a reliable indicator of future performance.
 Please wait processing your request...