AAPL 258.8189 0.2397% MSFT 439.14 -0.0432% NVDA 140.185 -0.025% GOOGL 196.0128 -0.0496% GOOG 197.54 -0.0152% AMZN 227.87 -0.5152% META 603.74 -0.6598% AVGO 245.6915 2.5081% TSLA 452.9125 -2.0264% TSM 204.19 -1.0372% LLY 797.2122 0.1938% V 320.96 0.0967% JPM 242.37 0.0248% UNH 509.62 0.6955% NVO 87.85 0.5494% WMT 92.38 -0.3237% LVMUY 132.91 0.4459% XOM 106.31 -0.0846% LVMHF 664.0 0.9119% MA 536.2159 0.0944%

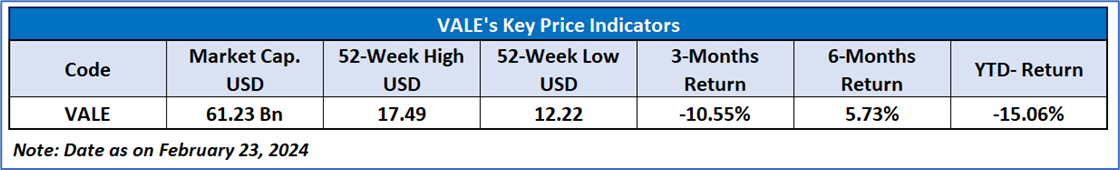
Vale SA, (NYSE: VALE)
Vale SA, (NYSE: VALE) formerly Companhia Vale do Rio Doce, is a Brazil-based metal and mining company which is primarily engaged in producing iron ore and nickel.
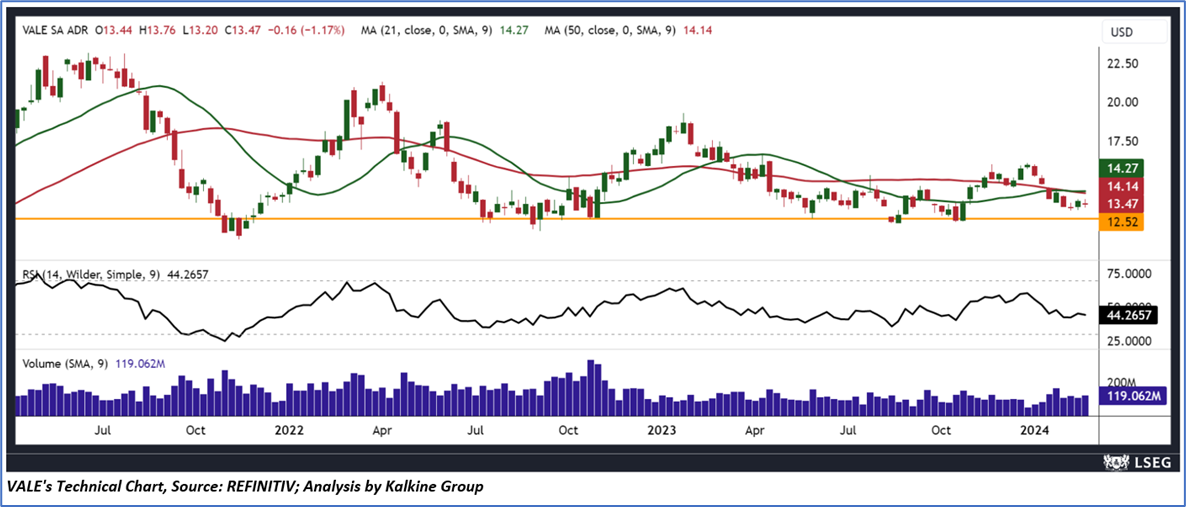
Technical Observation (on the weekly chart):
The current trading price of VALE's stock is close to a significant trendline support level and consolidating in a very narrow range, possibly indicating an imminent upward trend reversal. Additionally, the 14-day Relative Strength Index (RSI) is near the midpoint, which could lead to a corrective bounce towards higher values. This suggests a positive outlook for the stock's price movement. However, it is crucial to note that the stock is presently below both the 21-day and 50-day Simple Moving Averages (SMAs), which might act as temporary resistance levels in the upcoming period.
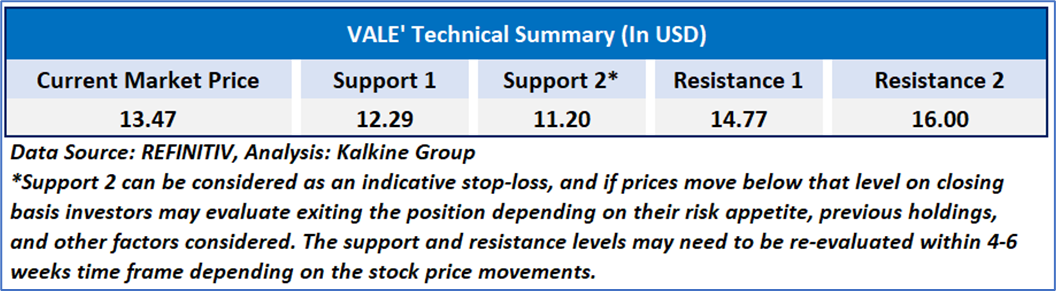
As per the above-mentioned price action, recent key business and financial updates, momentum in the stock over the last month, and technical indicators analysis, a ‘Hold’ rating has been given to Vale SA at its closing price of USD 13.47 as of February 23, 2024.
Individuals can evaluate the stock based on the support and resistance levels provided in the report in case of keen interest taking into consideration the risk-reward scenario.
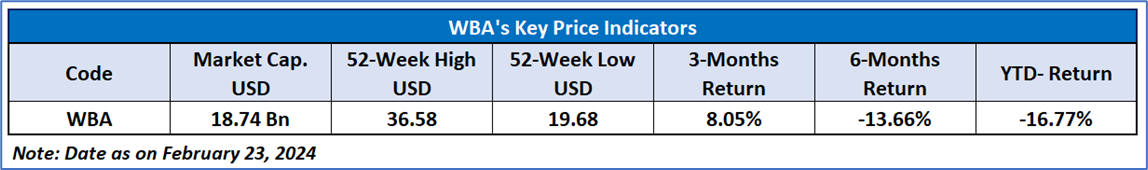
Walgreens Boots Alliance, Inc.
Walgreens Boots Alliance, Inc. (NASDAQ: WBA) is a retail pharmacy chain operating approximately 13,000 stores across the United States and various international locations.
Technical Observation (on the daily chart):
WBA's stock price is near a key support line and appears to be narrowly fluctuating, possibly foreshadowing a reverse trend upward. The 14-day RSI being around the midpoint may cause an upward correction towards higher values, suggesting a positive projection for the stock's price movement. However, it's essential to recognize that the stock is currently beneath both the 21-day and 50-day SMAs, which could act as temporary barriers in the forthcoming period.
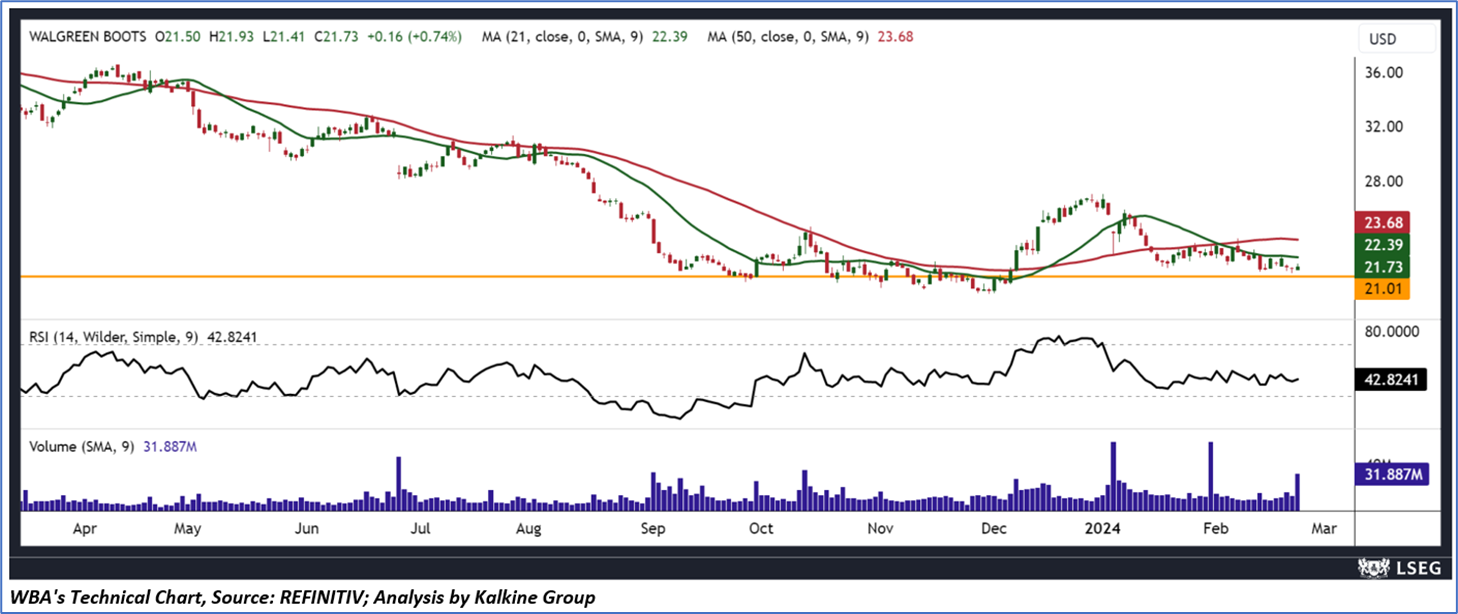
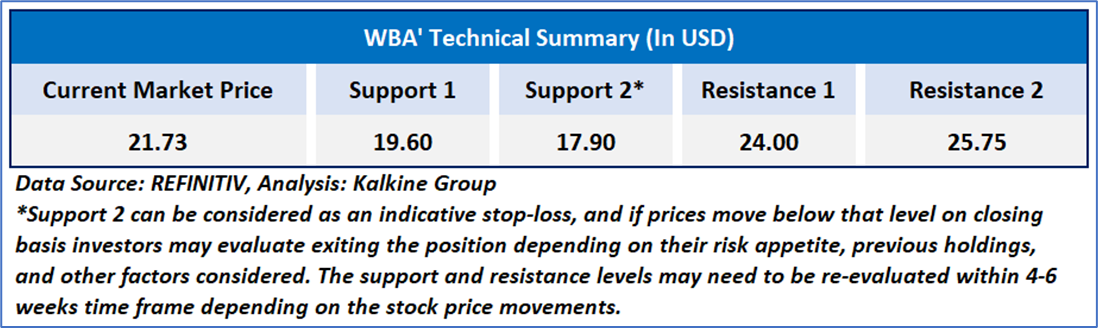
As per the above-mentioned price action, recent key business and financial updates, momentum in the stock over the last month, and technical indicators analysis, a ‘Hold’ rating has been given to Walgreens Boots Alliance, Inc. at its closing price of USD 21.73 as of February 23, 2024.
Individuals can evaluate the stock based on the support and resistance levels provided in the report in case of keen interest taking into consideration the risk-reward scenario.
Markets are trading in a highly volatile zone currently due to certain macro-economic issues and prevailing geopolitical tensions. Therefore, it is prudent to follow a cautious approach while investing.
Related Risk: This report may be looked at from a high-risk perspective and a recommendation is provided for a short duration. This report is solely based on technical parameters, and the fundamental performance of the stocks has not been considered in the decision-making process. Other factors which could impact the stock prices include market risks, regulatory risks, interest rates risks, currency risks, social and political instability risks etc.
How to Read the Charts?
The yellow colour line reflects the 21-period simple moving average (SMA) while the blue line indicates the 50- period simple moving average (SMA). SMA helps to identify existing price trends. If the prices are trading above the 21-period and 50-period moving average, then it shows prices are currently trading in a bullish trend.
The orange colour line in the chart’s lower segment reflects the Relative Strength Index (14-Period) which indicates price momentum and signals momentum in trend. A reading of 70 or above suggests overbought status while a reading of 30 or below suggests an oversold status.
The red and green colour bars in the chart’s lower segment show the volume of the stock. The volume is the number of shares that changed hands during a given day. Stocks with high volumes are more liquid than stocks with lesser volume as liquidity in stocks helps with easier and faster execution of the order.
The Orange colour lines are the trend lines drawn by connecting two or more price points and used for trend identification purposes. The trend line also acts as a line of support and resistance.
Technical Indicators Defined: -
Support: A level at which the stock prices tend to find support if they are falling, and a downtrend may take a pause backed by demand or buying interest. Support 1 refers to the nearby support level for the stock and if the price breaches the level, then Support 2 may act as the crucial support level for the stock.
Resistance: A level at which the stock prices tend to find resistance when they are rising, and an uptrend may take a pause due to profit booking or selling interest. Resistance 1 refers to the nearby resistance level for the stock and if the price surpasses the level, then Resistance 2 may act as the crucial resistance level for the stock.
Stop-loss: It is a level to protect further losses in case of unfavourable movement in the stock prices.
Past performance is neither an indicator nor a guarantee of future performance.
The reference date for all price data, currency, technical indicators, support, and resistance levels is February 23, 2024. The reference data in this report has been partly sourced from REFINITIV.
Abbreviations
CMP: Current Market Price
SMA: Simple Moving Average
RSI: Relative Strength Index
USD: United States dollar
Note: Trading decisions require a thorough analysis by individual. Technical reports in general chart out metrics that may be assessed by individuals before any stock evaluation. The above are illustrative analytical factors used for evaluating stocks; other parameters can be looked at along with additional risks per se. Past performance is neither an indicator nor a guarantee of future performance.
Kalkine Equities LLC provides general information about companies and their securities. The information contained in the reports, including any recommendations regarding the value of or transactions in any securities, does not take into account any of your investment objectives, financial situation or needs. Kalkine Equities LLC is not registered as an investment adviser in the U.S. with either the federal or state government. Before you make a decision about whether to invest in any securities, you should take into account your own objectives, financial situation and needs and seek independent financial advice. All information in our reports represents our views as at the date of publication and may change without notice.
Kalkine Media LLC, an affiliate of Kalkine Equities LLC, may have received, or be entitled to receive, financial consideration in connection with providing information about certain entity(s) covered on its website.
 US
US  AU
AU UK
UK CA
CA NZ
NZ Please wait processing your request...