
Canadian Solar Inc.
CSIQ Details
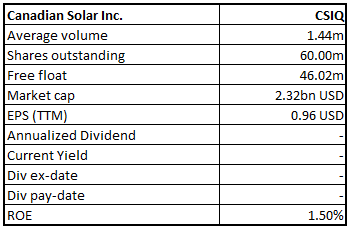
Canadian Solar Inc. (NASDAQ: CSIQ) is a manufacturer of solar photovoltaic modules, provider of solar energy and battery storage solutions, and developer of utility-scale solar power and battery storage projects. It has delivered over 55 GW solar photovoltaic modules in over 150 countries.
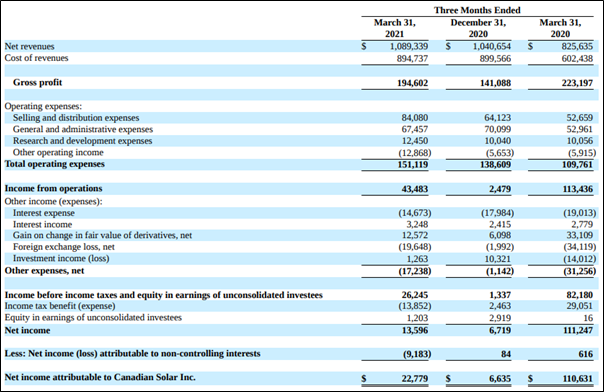
Result Performance – For the first quarter ended 31 March 2021 – (Q1FY21)
Key Data (Source: Company Reports)
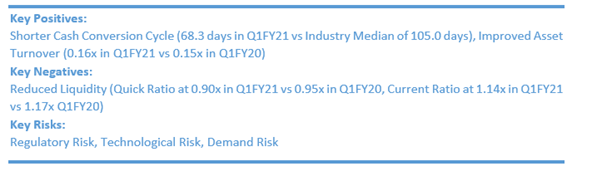
Recent Update:
Risks:
The company could be impacted by the volatile solar power market and industry dynamics, especially if the demand for solar power products and services declines significantly. The mix of revenues from CSI Solar and Global Energy segments could be subject to significant fluctuation because of the number of factors. The continued growth strategy relies upon the continued availability of third-party financing arrangements.
Outlook:
Q2FY21 Guidance: Total module shipments to be in the ambit of 3.5-3.7 GW, including ~80 MW of module shipments to the CSIQ’s projects. Total revenues are expected to be in the ambit of $1.4-$1.5 billion and gross margin between 9.5%- 10.5%.
FY21 Guidance: Total module shipment is expected in the range of 18-20 GW and sales guidance of 1.8-2.3 GW. The company gave total battery storage shipment guidance of 810-860 MWh and total revenue expected to be in the ambit of $5.6-$6.0 billion.
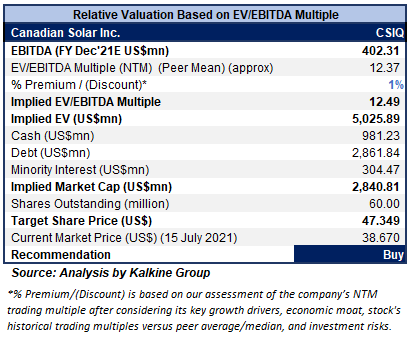
Valuation Methodology: EV/EBITDA Multiple Based Relative Valuation (Illustrative)
Stock Recommendation:
The stock has made a 52-week low and high of $21.65 and $67.39, respectively and is currently trading below the average of 52-week high-low range.
Considering the aforesaid facts, we have valued the stock using an EV/EBITDA multiple-based illustrative relative valuation and have arrived at a target price which reflects a rise of low double-digit (in % terms). We believe the company can trade at a slight premium to its EV/EBITDA Multiple (NTM) (Peer Mean) considering strong Q1FY21 result and stronger guidance for Q2FY21 and FY21.
Considering the aforesaid facts, we give a “Buy” recommendation on the stock at the current market price of $38.67 per share, down 2.37% on 15th July 2021.
Technical Chart:
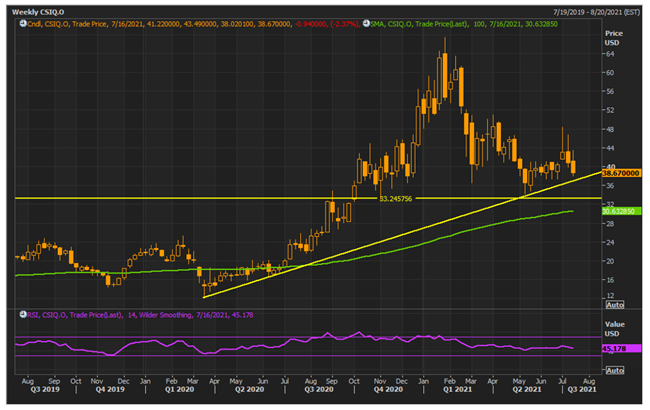
Source: REFINITIV
Amicus Therapeutics, Inc.
FOLD Details
Amicus Therapeutics, Inc. (NASDAQ: FOLD) is a patient-dedicated biotechnology company primarily focused on discovering, developing, and delivering novel medicines for rare diseases. The product opportunities include oral monotherapy for Fabry disease, a differentiated biologic for Pompe disease, and a rare disease gene therapy portfolio.
Result Performance – For the first quarter ended 31 March 2021 – (Q1FY21)
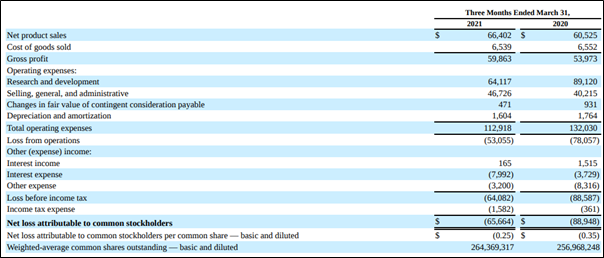
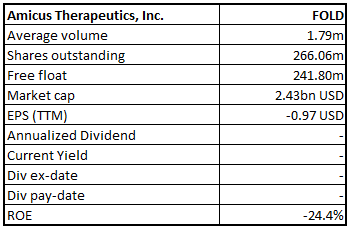
Key Data (Source: Company Reports)
Recent Update:
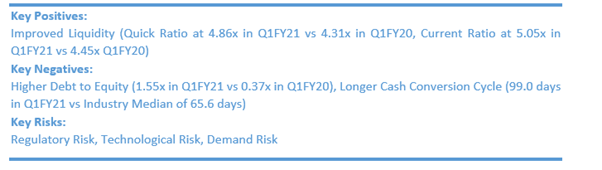
Risks:
The company is dependent on sales of Galafold in Europe, the US, and Japan for its growth perspective. Further, any delays in obtaining required regulatory approvals will impact the commercialization of product or product candidates, thereby, impacting revenue generation.
Outlook:
FY21 Revenue Guidance: For FY21, the company forecasts total Galafold revenue of $300-$315 million driven by continued operational momentum and commercial execution across all major markets like the US, EU, UK, and Japan.
FY21 Operating Expense Guidance: For FY21, non-GAAP operating expense is expected in the ambit of $410-$420 million, led by continued investment in the global Galafold launch, AT-GAA clinical studies, pre-launch activities, and advancing gene therapy pipeline.
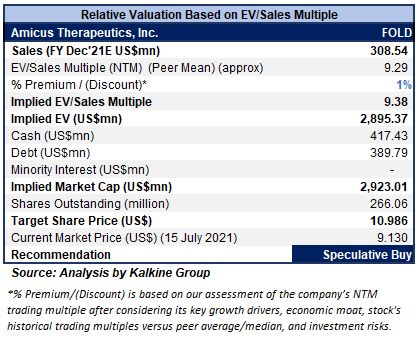
Valuation Methodology: EV/Sales Multiple Based Relative Valuation (Illustrative)
Stock Recommendation:
The stock has made a 52-week low and high of $8.68 and $25.39, respectively and is currently trading below the average of 52-week high-low range.
Considering the aforesaid facts, we have valued the stock using an EV/Sales multiple-based illustrative relative valuation and have arrived at a target price which reflects a rise of low double-digit (in % terms). We believe the company can trade at a slight premium to its EV/Sales Multiple (NTM) (Peer Mean) considering revenue growth in FY21, plan to expand EU label to cover adolescent population and geographic expansion by the company.
Considering the aforesaid facts, we give a “Speculative Buy” recommendation on the stock at the current market price of $9.13 per share, up 2.7% on 15th July 2021.
Technical Chart:
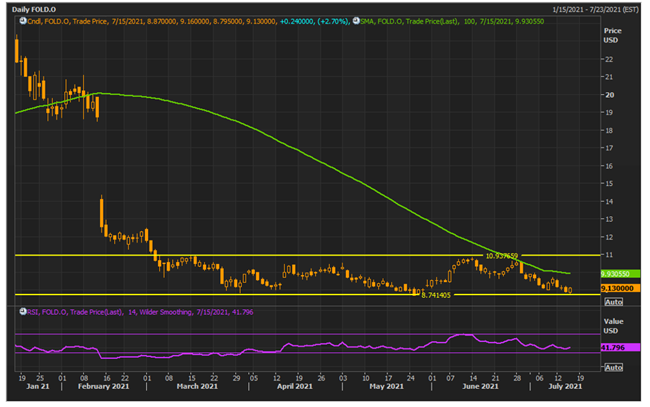
Source: REFINITIV
Note 1: The reference data in this report has been partly sourced from REFINITIV.
Note 2: Investment decisions should be made depending on the investors’ appetite on upside potential, risks, holding duration, and any previous holdings. Investors can consider exiting from the stock if the Target Price mentioned as per the analysis has been achieved and subject to the factors discussed above alongside support levels provided.
Technical Indicators Defined:-
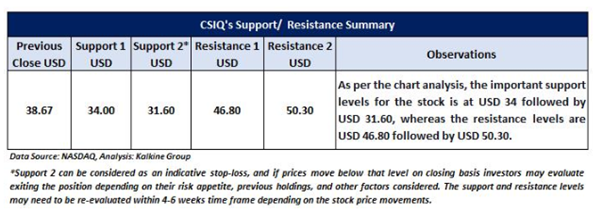
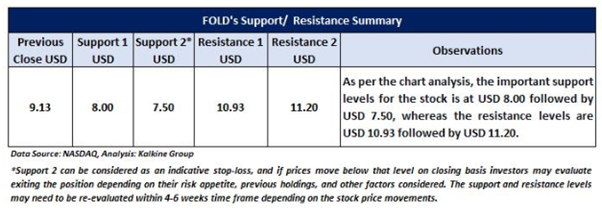
Support: A level where-in the stock prices tend to find support if they are falling, and downtrend may take a pause backed by demand or buying interest.
Resistance: A level where-in the stock prices tend to find resistance when they are rising, and uptrend may take a pause due to profit booking or selling interest.
Stop-loss: It is a level to protect further losses in case of unfavourable movement in the stock prices
Kalkine Equities LLC provides general information about companies and their securities. The information contained in the reports, including any recommendations regarding the value of or transactions in any securities, does not take into account any of your investment objectives, financial situation or needs. Kalkine Equities LLC is not registered as an investment adviser in the U.S. with either the federal or state government. Before you make a decision about whether to invest in any securities, you should take into account your own objectives, financial situation and needs and seek independent financial advice. All information in our reports represents our views as at the date of publication and may change without notice.
Kalkine Media LLC, an affiliate of Kalkine Equities LLC, may have received, or be entitled to receive, financial consideration in connection with providing information about certain entity(s) covered on its website.
Past performance is not a reliable indicator of future performance.
 Please wait processing your request...