
This report is an updated version of the report published on 25 June 2025 at 11:15 AM AEST
Appen Limited (ASX: APX)
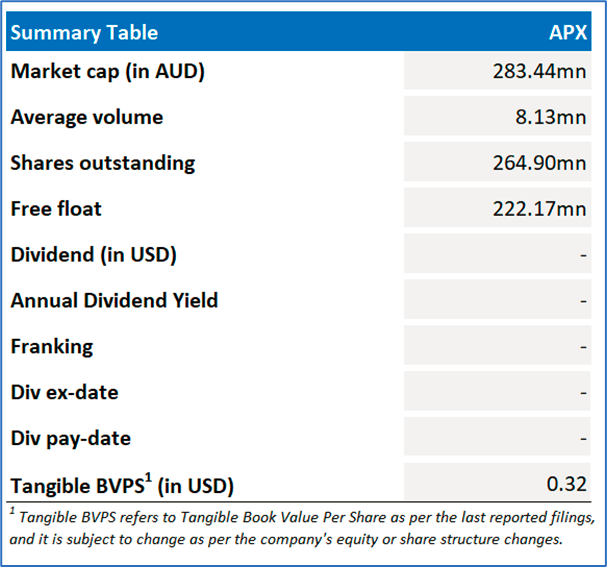
Company Overview: Appen Limited (ASX: APX) specialises in providing data for the AI lifecycle, backed by over 28 years of expertise in data sourcing, annotation, and evaluation. With a diverse crowd of over 1 million skilled contractors fluent in more than 500 languages, the company enables organisations to develop innovative AI systems. Its comprehensive products and services instil confidence in leaders across technology, automotive, finance, retail, healthcare, and government sectors.
Recommendation Rationale – SELL at AUD 1.160
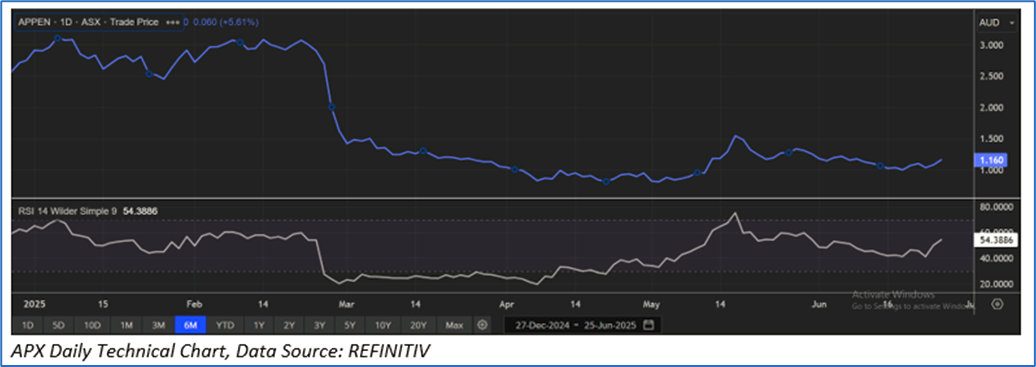
APX Daily Chart
Valuation Methodology: EV/Sales Relative Valuation Approach (FY Dec'25E) (Illustrative)
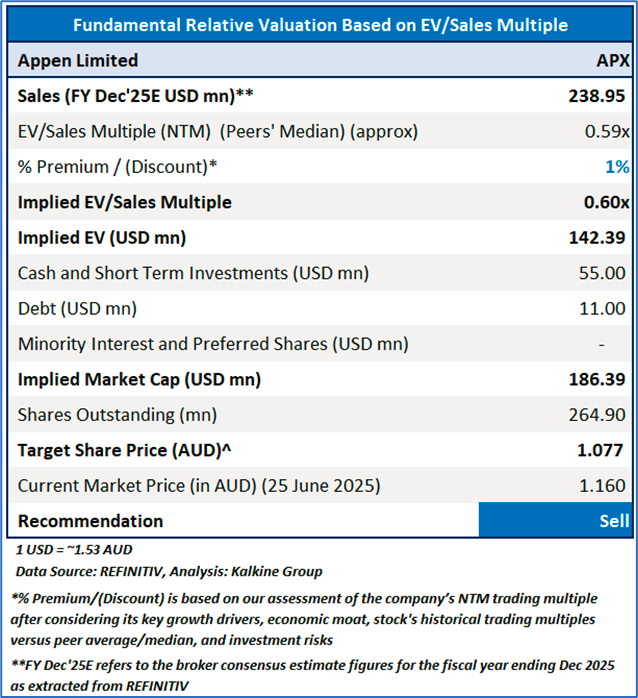
Considering the large technology clients in the US and China, positive net cash flow from operations, incorporating generative AI into its platforms for higher quality data delivery, the stock might trade at some premium to its peers. For valuation, few peers like Iress Ltd (ASX: IRE), Integrated Research Ltd (ASX: IRI), and Infomedia Ltd (ASX: IFM) have been considered.
Considering that the stock is trading near to its R2 level, macroeconomic uncertainty, rally in share price movement, current trading level, and risks associated, the share price can face consolidation at the current levels. Hence, a ‘Sell’ recommendation is given on the stock at the current price of AUD 1.16 (as of 25 June 2025, at 10:35 AM AEST).
Note: This report may be updated with details around fundamental and technical analysis, price/ chart in due course, as appropriate.
Note 1: Past performance is neither an indicator nor a guarantee of future performance.
Note 2: The reference date for all price data, currency, technical indicators, support, and resistance levels is 25 June 2025. The reference data in this report has been partly sourced from REFINITIV.
Note 3: Investment decisions should be made depending on an individual's appetite for upside potential, risks, holding duration, and any previous holdings. An 'Exit' from the stock can be considered if the Target Price mentioned as per the Valuation and or the technical levels provided has been achieved and is subject to the factors discussed above.
Note 4: Kalkine reports are prepared based on the stock prices captured either from REFINITIV or Trading View. Typically, REFINITIV or Trading View may reflect stock prices with a delay which could be a lag of 25-30 minutes. There can be no assurance that future results or events will be consistent with the information provided in the report. The information is subject to change without any prior notice.
Technical Indicators Defined: -
Support: A level at which the stock prices tend to find support if they are falling, and a downtrend may take a pause backed by demand or buying interest. Support 1 refers to the nearby support level for the stock and if the price breaches the level, then Support 2 may act as the crucial support level for the stock.
Resistance: A level at which the stock prices tend to find resistance when they are rising, and an uptrend may take a pause due to profit booking or selling interest. Resistance 1 refers to the nearby resistance level for the stock and if the price surpasses the level, then Resistance 2 may act as the crucial resistance level for the stock.
Stop-loss: It is a level to protect further losses in case of unfavourable movement in the stock prices.
Kalkine Equities LLC, with Delaware File Number 4697384, Foreign Qualification Registration in California File Number 202109211078, and Texas File Number 805521396, is authorized to provide general advice only. The information on https://kalkine.com/ does not take into account any of your investment objectives, financial situation or needs. You should consider the appropriateness of advice taking into account your own objectives, financial situation and needs and seek independent financial advice before making any financial decisions. The link to our Terms and Conditions and Privacy Policy has been provided for your reference. On the date of publishing the reports (mentioned on the website), employees and/or associates of Kalkine do not hold positions in any of the stocks covered on the website. These stocks can change any time and readers of the reports should not consider these stocks as advice or recommendations later.
Past performance is not a reliable indicator of future performance.
 Please wait processing your request...