
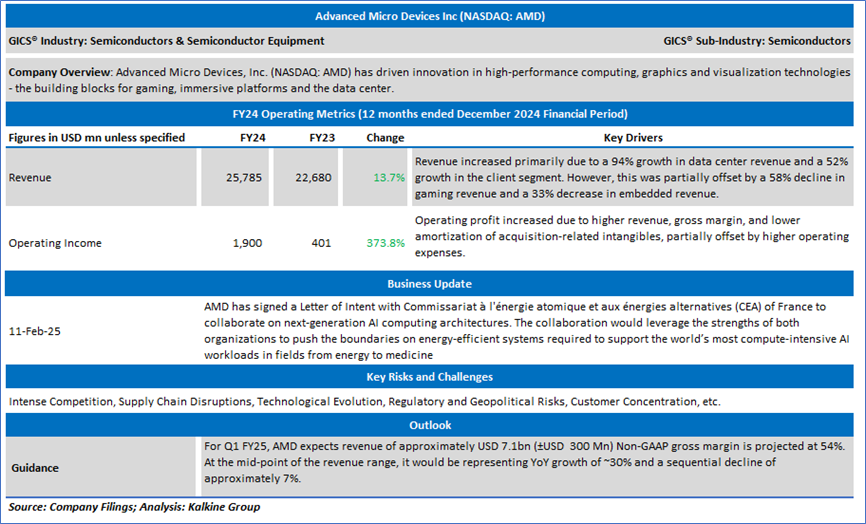
Company Overview: Advanced Micro Devices, Inc. (NASDAQ: AMD) has driven innovation in high-performance computing, graphics and visualization technologies - the building blocks for gaming, immersive platforms and the data center. Kalkine’s Daily Report covers the Key Financial Metrics, Risks, Outlook, Technical Analysis along with the Valuation, Target Price, and Recommendation on the stock.
Section 1.0: Key Metrics in Pictures
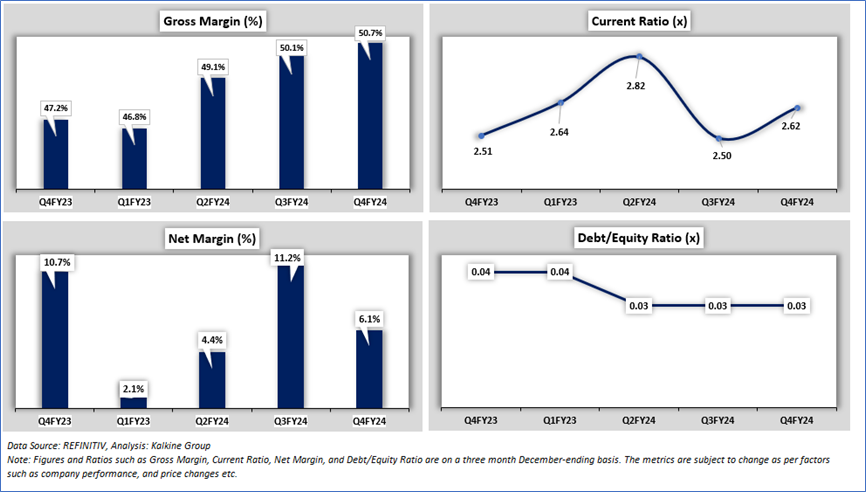
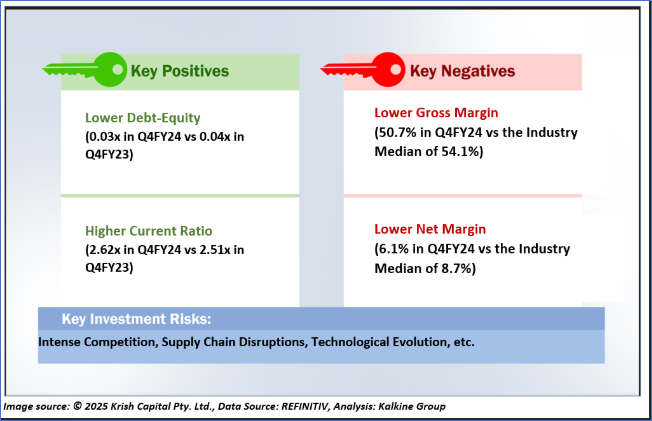
Having looked at the key financial ratios above the below sections provide an in-depth fundamental, and technical analysis on this Semiconductor stock along with recommendations, technical support and resistance levels and indicative stop-loss.
Section 2.0 Advanced Micro Devices, Inc. (NASDAQ: AMD) (‘Buy’ at USD 100.31, Closing Market Price as on 07 March 2025)
2.1 Company Details
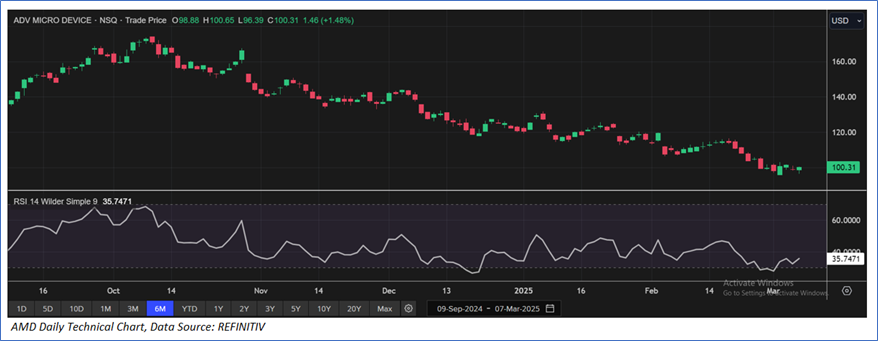
2.2 Valuation, Stock Recommendation, and Technical Guidance
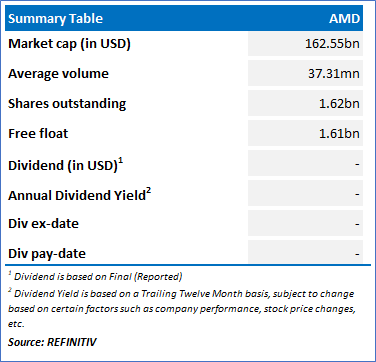
The stock has witnessed a decline of ~25.34% in the last six months and over the last nine months, it has declined by ~40.25%. The stock has a 52-week low and 52-week high of USD 95.89 and USD 227.30, respectively and is currently trading below the average of 52-week low and high. AMD was last covered in a report dated ’19 February 2025’.

Advanced Micro Devices, Inc. (NASDAQ: AMD) is part of Kalkine’s Global Big Money Portfolio
Note 1: Past performance is not a reliable indicator of future performance.
Note 2: The reference date for all price data, currency, technical indicators, support, and resistance levels is 07 March 2025. The reference data in this report has been partly sourced from REFINITIV.
Note 3: Investment decisions should be made depending on an individual's appetite for upside potential, risks, holding duration, and any previous holdings. An 'Exit' from the stock can be considered if the Target Price mentioned as per the Valuation and or the technical levels provided has been achieved and is subject to the factors discussed above.
Note 4: Kalkine reports are prepared based on the stock prices captured either from REFINITIV or Trading View. Typically, REFINITIV or Trading View may reflect stock prices with a delay which could be a lag of 25-30 minutes. There can be no assurance that future results or events will be consistent with the information provided in the report. The information is subject to change without any prior notice.
Technical Indicators Defined: -
Support: A level at which the stock prices tend to find support if they are falling, and a downtrend may take a pause backed by demand or buying interest. Support 1 refers to the nearby support level for the stock and if the price breaches the level, then Support 2 may act as the crucial support level for the stock.
Resistance: A level at which the stock prices tend to find resistance when they are rising, and an uptrend may take a pause due to profit booking or selling interest. Resistance 1 refers to the nearby resistance level for the stock and if the price surpasses the level, then Resistance 2 may act as the crucial resistance level for the stock.
Stop-loss: It is a level to protect further losses in case of unfavourable movement in the stock prices.
Kalkine Equities LLC, with Delaware File Number 4697384, Foreign Qualification Registration in California File Number 202109211078, and Texas File Number 805521396, is authorized to provide general advice only. The information on https://kalkine.com/ does not take into account any of your investment objectives, financial situation or needs. You should consider the appropriateness of advice taking into account your own objectives, financial situation and needs and seek independent financial advice before making any financial decisions. The link to our Terms and Conditions and Privacy Policy has been provided for your reference. On the date of publishing the reports (mentioned on the website), employees and/or associates of Kalkine do not hold positions in any of the stocks covered on the website. These stocks can change any time and readers of the reports should not consider these stocks as advice or recommendations later.
Past performance is not a reliable indicator of future performance.
 Please wait processing your request...