
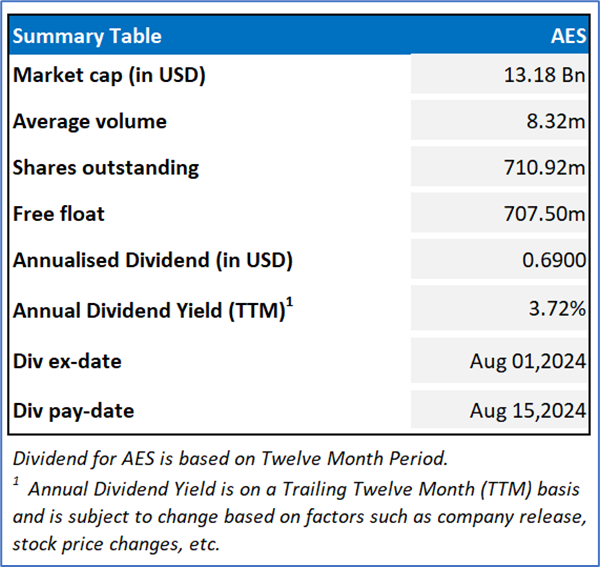
The AES Corporation (NYSE: AES)
The AES Corporation (NYSE: AES) is the power generation and utility company. It operates through 4 segments: Renewables, Utilities, Energy Infrastructure, and New Energy Technologies.
Recommendation Rationale – Sell at USD 18.54
AES’ Daily Price Chart
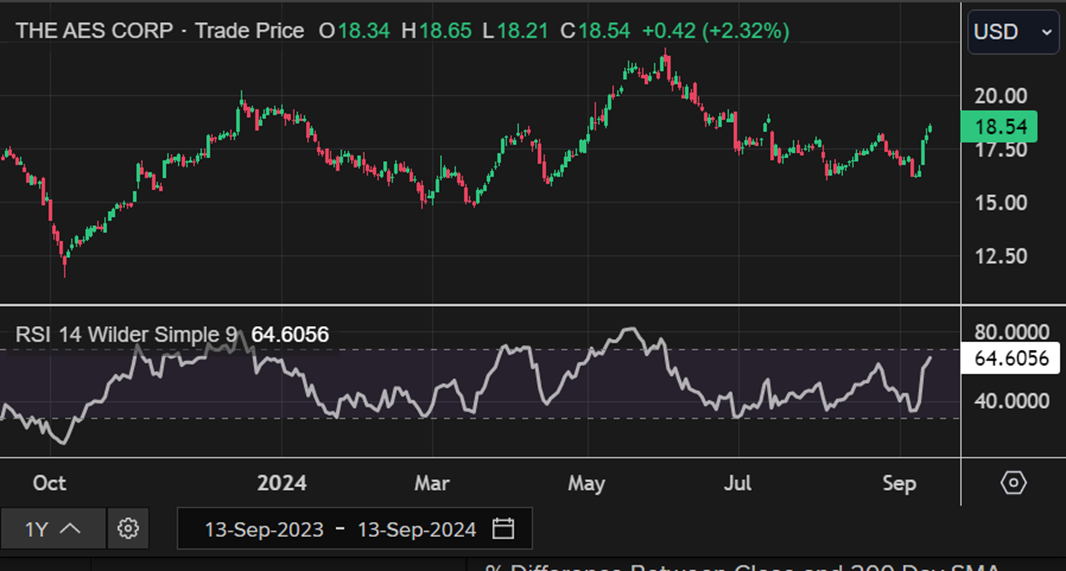
AES Daily Technical Chart, Data Source: REFINITIV
Fundamental Valuation
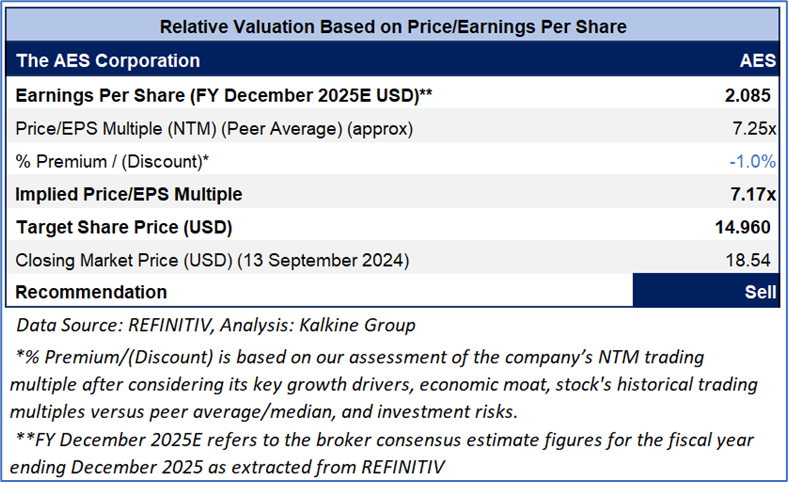
AES is exposed to the risks related adverse economic developments in China, higher competition, etc.
Therefore, AES is expected to trade at slight discount considering the risks associated. For conducting the valuation, the following peers have been considered: NRG Energy Inc. (NRG.N), ENGIE Energia Chile SA, etc.
Given its current trading levels, and risks associated, it is prudent to book profit at the current levels.
Hence, a ‘Sell’ rating has been provided on the stock at the closing market price of USD 18.54 per share, up by 2.32% as on 13 September 2024.
The AES Corporation (NYSE: AES) forms part of Kalkine’s Global Big Money Portfolio.
Markets are trading in a highly volatile zone currently due to certain macro-economic issues and geopolitical issues prevailing geopolitical tensions. Therefore, it is prudent to follow a cautious approach while investing.
Note 1: Past performance is neither an indicator nor a guarantee of future performance.
Note 2: The reference date for all price data, currency, technical indicators, support, and resistance levels is 13 September 2024. The reference data in this report has been partly sourced from REFINITIV.
Note 3: Investment decisions should be made depending on an individual's appetite for upside potential, risks, holding duration, and any previous holdings. An 'Exit' from the stock can be considered if the Target Price mentioned as per the Valuation and or the technical levels provided has been achieved and is subject to the factors discussed above.
Technical Indicators Defined: -
Support: A level at which the stock prices tend to find support if they are falling, and downtrend may take a pause backed by demand or buying interest.
Resistance: A level at which the stock prices tend to find resistance when they are rising, and uptrend may take a pause due to profit booking or selling interest.
Stop-loss: In general, it is a level to protect further losses in case of any unfavourable movement in the stock prices.
Kalkine Equities LLC, with Delaware File Number 4697384, Foreign Qualification Registration in California File Number 202109211078, and Texas File Number 805521396, is authorized to provide general advice only. The information on https://kalkine.com/ does not take into account any of your investment objectives, financial situation or needs. You should consider the appropriateness of advice taking into account your own objectives, financial situation and needs and seek independent financial advice before making any financial decisions. The link to our Terms and Conditions and Privacy Policy has been provided for your reference. On the date of publishing the reports (mentioned on the website), employees and/or associates of Kalkine do not hold positions in any of the stocks covered on the website. These stocks can change any time and readers of the reports should not consider these stocks as advice or recommendations later.
Copyright © 2024 Krish Capital Pty Ltd. All rights reserved.
Past performance is not a reliable indicator of future performance.
 Please wait processing your request...