
This report is an updated version of the report published on 27 November 2024.
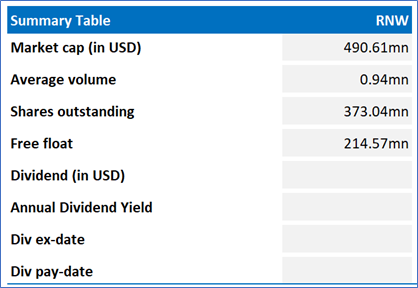
ReNew Energy Global PLC (NASDAQ: RNW)
ReNew Energy Global PLC (NASDAQ: RNW) is a leading decarbonization solutions company listed on Nasdaq. ReNew's clean energy contracted portfolio, which stood at approximately 16.3 GWs as of November 19, 2024, is among the largest in the world.
Recommendation Rationale – SELL at USD 6.14
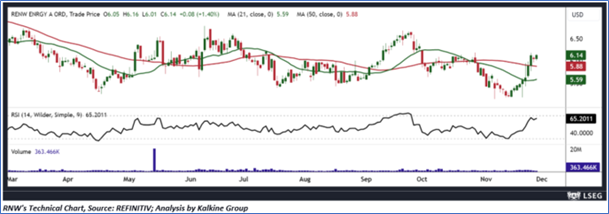
RNW Daily Price Chart
Valuation Methodology: EV/Sales Approach (FY March'26E) (Illustrative)
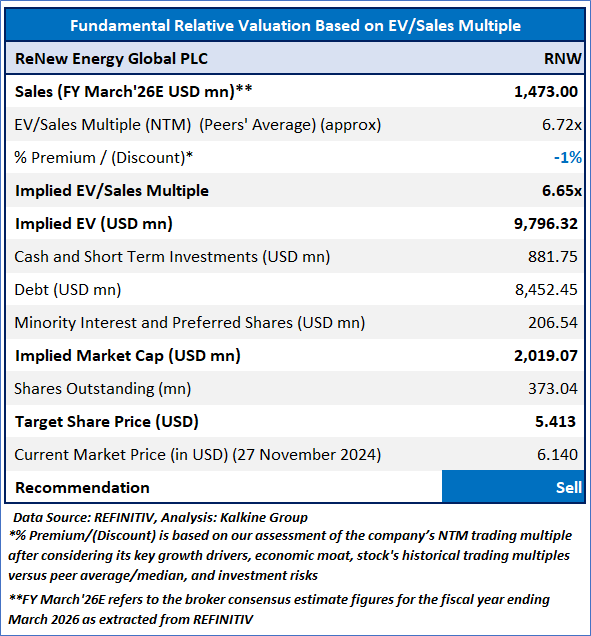
Considering factors such as the decline in net profit in H1FY25, decline in cash flow to equity (CFe), and the company's expectation that adjusted EBITDA and Cash Flow to Equity (CFe) in FY25 will be dependent on weather conditions mirroring those of FY24, the stock might trade at a slight discount to its peers. For conducting the valuation, the following peers have been considered: Ormat Technologies Inc (NYSE: ORA), Altus Power Inc (NYSE: AMPS), Spruce Power Holding Corp (NYSE: SPRU), and others.
Considering that the stock surpassed the R1 level, market uncertainties, and risks associated, the share price can witness resistance at the current levels. Hence, a ‘Sell’ recommendation is given on the stock at the current market price of USD 6.14, as of 27 November 2024, at 9:15 AM EST.
'Renew Energy Global PLC (NASDAQ:RNW) is a part of Global Green Energy Portfolio.'
Markets are trading in a highly volatile zone currently due to certain macro-economic issues and geopolitical issues prevailing geopolitical tensions. Therefore, it is prudent to follow a cautious approach while investing.
Note 1: Past performance is neither an indicator nor a guarantee of future performance.
Note 2: The reference date for all price data, currency, technical indicators, support, and resistance levels is 27 November 2024. The reference data in this report has been partly sourced from REFINITIV.
Note 3: Investment decisions should be made depending on an individual's appetite for upside potential, risks, holding duration, and any previous holdings. An 'Exit' from the stock can be considered if the Target Price mentioned as per the Valuation and or the technical levels provided has been achieved and is subject to the factors discussed above.
Technical Indicators Defined: -
Support: A level at which the stock prices tend to find support if they are falling, and downtrend may take a pause backed by demand or buying interest.
Resistance: A level at which the stock prices tend to find resistance when they are rising, and uptrend may take a pause due to profit booking or selling interest.
Stop-loss: In general, it is a level to protect further losses in case of any unfavourable movement in the stock prices.
Kalkine Equities LLC, with Delaware File Number 4697384, Foreign Qualification Registration in California File Number 202109211078, and Texas File Number 805521396, is authorized to provide general advice only. The information on https://kalkine.com/ does not take into account any of your investment objectives, financial situation or needs. You should consider the appropriateness of advice taking into account your own objectives, financial situation and needs and seek independent financial advice before making any financial decisions. The link to our Terms and Conditions and Privacy Policy has been provided for your reference. On the date of publishing the reports (mentioned on the website), employees and/or associates of Kalkine do not hold positions in any of the stocks covered on the website. These stocks can change any time and readers of the reports should not consider these stocks as advice or recommendations later.
Copyright © 2024 Krish Capital Pty Ltd. All rights reserved.
Past performance is not a reliable indicator of future performance.
 Please wait processing your request...