Starbucks Corporation
Starbucks Corporations (NASDAQ: SBUX) is a coffee company, which roasts, markets and retails specialty coffee in the world. The Company operates in 86 markets and has approximately 38,000 stores worldwide. It has three segments: North America, International and Channel Development.
Recent Business and Financial Updates
Q3 Fiscal 2024 Highlights:
- Global Comparable Store Sales: In the third quarter of fiscal 2024, global comparable store sales decreased by 3%, primarily due to a 5% decline in comparable transactions, partially offset by a 2% increase in average ticket value.
- North America Comparable Store Sales: Comparable store sales in North America decreased by 2%, driven by a 6% decline in comparable transactions. This decline was partially mitigated by a 3% increase in average ticket value. In the U.S., comparable store sales also fell by 2%, with a 6% decline in transactions offset by a 4% increase in average ticket value.
- International Comparable Store Sales: Internationally, comparable store sales decreased by 7%, attributed to a 4% decline in average ticket value and a 3% decline in comparable transactions. In China, comparable store sales experienced a significant decline of 14%, with both average ticket value and comparable transactions decreasing by 7%.
- Store Openings and Portfolio: The company opened 526 net new stores in Q3, bringing the total to 39,477 stores. Of these, 52% are company-operated and 48% are licensed. By the end of Q3, stores in the U.S. and China comprised 61% of the global portfolio, with 16,730 stores in the U.S. and 7,306 stores in China.
- Net Revenues: Consolidated net revenues declined by 1% to USD 9.1 billion, although there was a 1% increase on a constant currency basis.
- Operating Margin: The GAAP operating margin contracted by 60 basis points year-over-year to 16.7%. This contraction was mainly driven by increased promotional activity, investments in store partner wages and benefits, and deleverage, partially offset by pricing and in-store operational efficiencies. Non-GAAP operating margin also contracted by 70 basis points year-over-year to 16.7% on a constant currency basis.
- Earnings Per Share: GAAP earnings per share decreased by 6% to USD 0.93. Similarly, non-GAAP earnings per share declined by 7% year-over-year to USD 0.93, or a 6% decline on a constant currency basis.
- Starbucks Rewards Loyalty Program: The Starbucks Rewards loyalty program saw a 7% year-over-year increase in its 90-day active members in the U.S., totaling 33.8 million.
North America Segment:
- Net revenues for the North America segment increased by 1% over Q3 FY23 to USD 6.8 billion in Q3 FY24. This growth was driven by a 5% increase in net new company-operated stores over the past 12 months and growth in the licensed store business. This increase was partially offset by a 2% decline in comparable store sales, driven by a 6% decline in comparable transactions, partially offset by a 3% increase in average ticket.
- Operating income for this segment decreased to USD 1.4 billion in Q3 FY24, compared to USD 1.5 billion in Q3 FY23. The operating margin contracted to 21.0% from 21.7% in the previous year, primarily due to investments in store partner wages and benefits, increased promotional activity, and deleverage. However, this contraction was partially offset by pricing and in-store operational efficiencies.
International Segment:
- Net revenues for the international segment declined by 7% over Q3 FY23 to USD 1.8 billion in Q3 FY24. This decline was driven by an approximate 5% unfavourable impact from foreign currency translation and a 7% decline in comparable store sales, which included a 4% decline in average ticket and a 3% decline in comparable transactions. Additionally, there were lower product and equipment sales to, and royalty revenues from, licensees. However, this decline was partially offset by an 11% increase in net new company-operated stores over the past 12 months.
- Operating income for this segment decreased to USD 287.5 million in Q3 FY24 from USD 374.5 million in Q3 FY23. The operating margin contracted to 15.6% from 19.0% in the previous year, primarily due to promotional activities, investments in store partner wages and benefits, and strategic investments. This contraction was partially offset by in-store operational efficiencies.
Channel Development Segment:
- Net revenues for the Channel Development segment declined by 2% over Q3 FY23 to USD 438.3 million in Q3 FY24. This decline was mainly due to reduced revenue from the Global Coffee Alliance, SKU optimization, and the sale of the Seattle's Best Coffee brand in the prior year. However, this decline was partially offset by an increase in global ready-to-drink revenue.
- Operating income for this segment increased to USD 235.2 million in Q3 FY24 from USD 208.0 million in Q3 FY23. The operating margin expanded to 53.7% from 46.3% in the prior year, primarily due to a sales mix shift, lower product costs related to the Global Coffee Alliance, and strength in the North American Coffee Partnership joint venture income.
Company Update:
- LGBTQIA2+ Support: In May, the company announced new commitments to support LGBTQIA2+ partners and communities, including an expanded partnership with the National Center for Transgender Equality. This initiative aims to provide transgender, non-binary, and gender non-conforming partners with support for name and gender marker changes.
- Board of Directors: In May, Satya Nadella resigned from the company's Board of Directors. Following his departure, the size of the Board was reduced to ten members.
- Partnership with Grubhub: In June, the company announced a partnership with Grubhub, introducing Starbucks Delivery with Grubhub in select U.S. markets, with plans for nationwide availability in all 50 states by August 2024. This initiative is expected to contribute significantly to U.S. revenue, potentially approaching USD 1 billion this fiscal year.
- Starbucks Studios: In June, the company launched Starbucks Studios, an initiative to produce original entertainment and amplify stories that advance the company's mission to foster human connection and joy, thereby enhancing the brand experience.
- Loyalty Partnerships: In June, Starbucks announced loyalty partnerships with Marriott Bonvoy and Hilton Honors in the U.S. and China, respectively. These partnerships allow Starbucks Rewards members to link accounts and unlock exclusive benefits for travel and coffee, creating additional value and supporting program growth.
- Dividend Declaration: The Board of Directors declared a cash dividend of USD 0.57 per share, payable on August 30, 2024, to shareholders of record on August 16, 2024. This marks the 57th consecutive quarter of dividend payouts, demonstrating the company's commitment to consistent value creation for shareholders, with a compound annual growth rate (CAGR) of approximately 20% over this period.
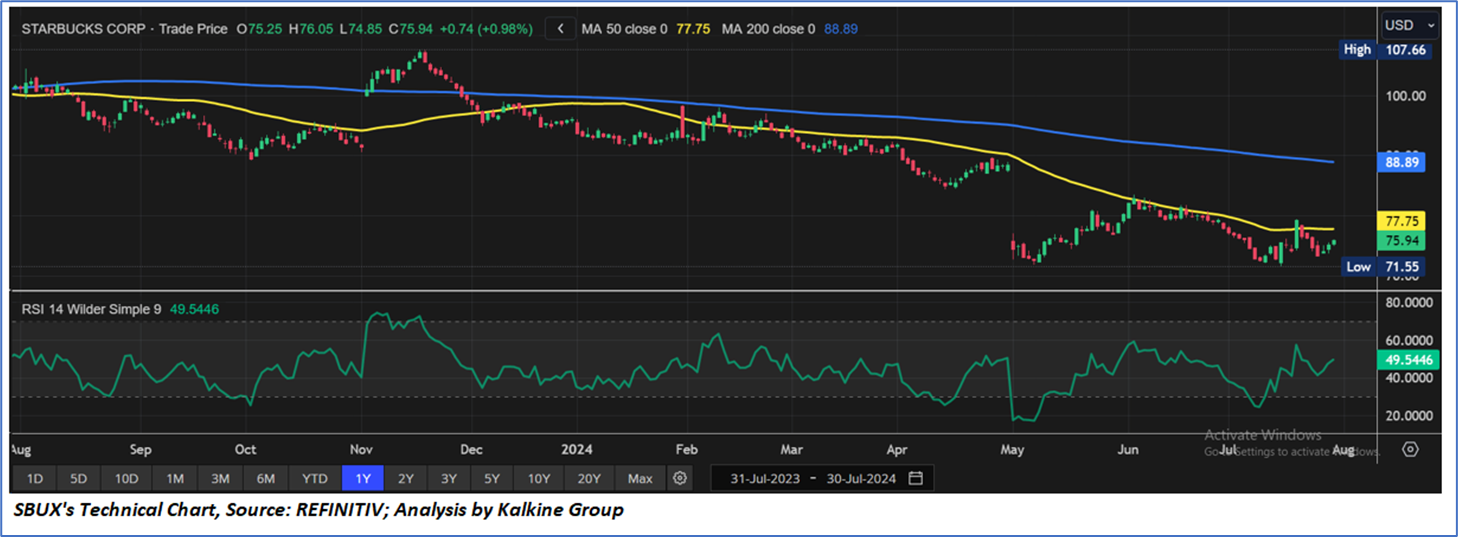
Technical Observation (on the daily chart):
The Relative Strength Index (RSI) over a 14-day period stands at a value of 49.54, upward trending with signs of divergence near the current levels, with expectations of an upward momentum. Additionally, the stock's current positioning is below both 50-Day SMA and 200-Day SMA, which can act as a short to medium term resistance levels.
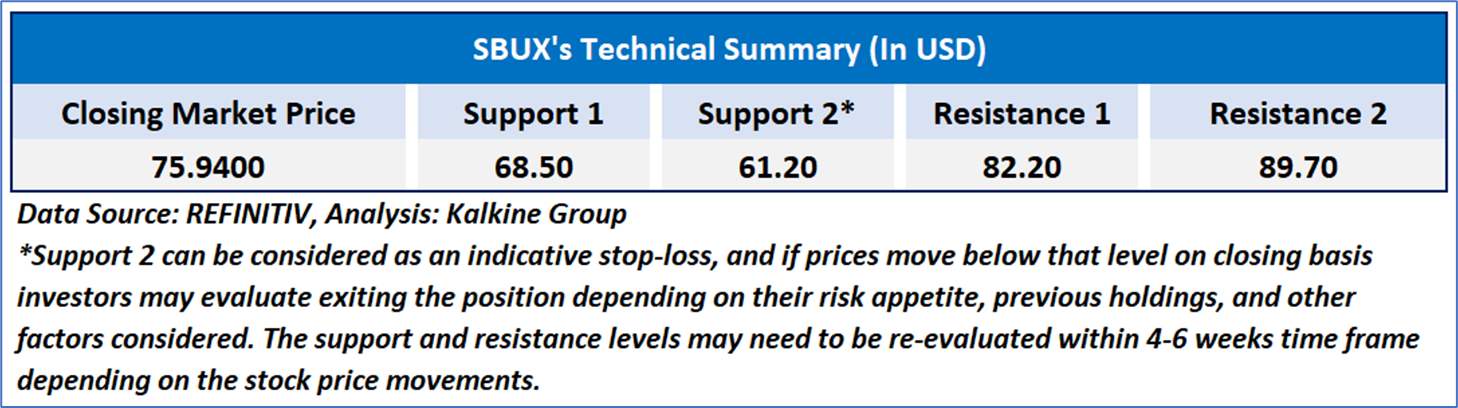
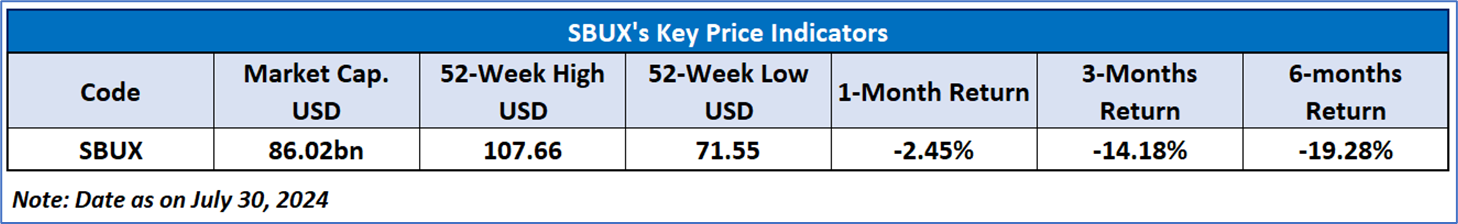
As per the above-mentioned price action, recent key business and financial updates, momentum in the stock over the last month, and technical indicators analysis, a ‘BUY’ rating has been given to Starbucks Corporations (NASDAQ: SBUX) at the closing market price of USD 75.94 as of July 30, 2024.
Individuals can evaluate the stock based on the support and resistance levels provided in the report in case of keen interest taking into consideration the risk-reward scenario.
Markets are trading in a highly volatile zone currently due to certain macro-economic issues and prevailing geopolitical tensions. Therefore, it is prudent to follow a cautious approach while investing.
Related Risk: This report may be looked at from a high-risk perspective and a recommendation is provided for a short duration. This report is solely based on technical parameters, and the fundamental performance of the stocks has not been considered in the decision-making process. Other factors which could impact the stock prices include market risks, regulatory risks, interest rates risks, currency risks, social and political instability risks etc.
Note 1: Past performance is not a reliable indicator of future performance.
Note 2: The reference date for all price data, currency, technical indicators, support, and resistance level is July 30, 2024. The reference data in this report has been partly sourced from REFINITIV.
Note 3: Investment decisions should be made depending on an individual's appetite for upside potential, risks, holding duration, and any previous holdings. An 'Exit' from the stock can be considered if the Target Price mentioned as per the Valuation and or the technical levels provided has been achieved and is subject to the factors discussed above.
Note 4: Target Price refers to a price level that the stock is expected to reach as per the relative valuation method and or technical analysis taking into consideration both short-term and long-term scenarios.s
Note 5: ‘Kalkine reports are prepared based on the stock prices captured either from the New York Stock Exchange (NYSE), NASDAQ Capital Markets (NASDAQ), and or REFINITIV. Typically, all sources (NYSE, NASDAQ, or REFINITIV) may reflect stock prices with a delay which could be a lag of 15-20 minutes. There can be no assurance that future results or events will be consistent with the information provided in the report. The information is subject to change without any prior notice.

 Please wait processing your request...