MSFT 417.14 0.9731% AAPL 229.0 -0.3438% NVDA 119.37 1.5137% GOOGL 163.38 0.989% GOOG 165.11 1.0465% AMZN 178.5 3.7067% META 521.31 0.5963% AVGO 162.82 3.7533% TSLA 214.11 3.7958% TSM 171.7 1.5075% LLY 960.02 2.1081% V 276.37 0.7473% JPM 224.8 1.1656% UNH 590.2 -0.2316% NVO 139.16 1.1926% WMT 77.23 1.0599% LVMUY 149.005 -0.3844% XOM 117.94 -0.1608% LVMHF 745.0 -0.4011% MA 483.34 0.5283%

GoPro Inc
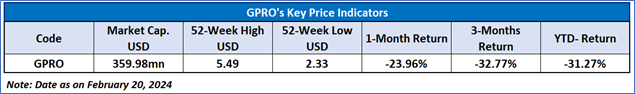
GoPro, Inc. (NASDAQ: GPRO) produces cameras, and mountable and wearable accessories. The Company offers a family of flagship cameras, including its cloud connected HERO12 Black, HERO11 Black, HERO11 Black Mini, HERO10 Black, HERO10 Black Bones, HERO9 Black, and MAX cameras.
Recent Financial and Business Updates:
Q4 2023 Financial Performance: A Mixed Bag: In the fourth quarter of 2023, GoPro faced revenue challenges with a year-over-year decrease of 8%, amounting to USD 295 million. However, a silver lining emerged as subscription and service revenue bucked the trend, experiencing a commendable 13% increase, reaching USD 25 million. Despite an overall decline, GoPro's subscriber count showed resilience, concluding the quarter at 2.5 million, signifying a robust 12% year-over-year growth.
Revenue Channels: Retail Shines, GoPro.com Sees Setback: The retail channel proved to be a stronghold for GoPro, contributing USD 228 million or 77% of total revenue, and displaying an impressive 18% year-over-year growth. Contrastingly, GoPro.com’s revenue, which includes subscription and service revenue, faced headwinds, totaling USD 67 million, constituting 23% of total revenue, and witnessing a notable 47% year-over-year decline.
Profit Dynamics: Margins, Earnings, and Adjusted EBITDA: Both GAAP and non-GAAP gross margins for Q4 2023 held strong at 34.2% and 34.4%, respectively. However, the company reported a GAAP net loss of USD 2 million (or USD 0.02 per share), a stark contrast from the net income of USD 3 million (or USD 0.02 per share) in the prior year period. Non-GAAP net income also took a hit, dropping to USD 2 million (or USD 0.02 per share), down from USD 21 million (or USD 0.12 per share) in the previous year. Adjusted EBITDA for Q4 2023 amounted to USD 3 million, a significant shift from the USD 22 million reported in the same quarter of the prior year.
2023: A Year of Financial Resilience and Challenges: For the full year 2023, GoPro's revenue tallied USD 1.0 billion, reflecting an 8% year-over-year decrease. Subscription and service revenue, however, defied the downturn, marking an 18% increase and reaching USD 97 million. The financial landscape showed a less favorable side as GAAP net loss for the year amounted to USD 53 million (or a USD 0.35 loss per share), compared to the net income of USD 29 million (or USD 0.18 per share) in the prior year. Non-GAAP net loss for the year was USD 31 million (or a USD 0.20 loss per share), a substantial drop from the non-GAAP net income of USD 81 million (or USD 0.47 per share) in the previous year. Both GAAP and non-GAAP gross margins for 2023 registered a decline at 32.2% and 32.4%, respectively. Notably, Adjusted EBITDA for 2023 reported a negative USD 27 million, representing a significant departure from the USD 95 million reported in the prior year period.
Business Highlights: Strategic Moves and Sponsorships: During the fourth quarter, GoPro strategically navigated capital allocations, repurchasing USD 50.0 million in aggregate principal amount of the 2025 Convertible Notes and USD 10.0 million in stock, contributing to a total repurchase of USD 40.0 million for 2023. In January 2024, GoPro unveiled plans to acquire Forcite Helmet Systems, an Australian tech-enabled motorcycle helmet manufacturer. Additionally, the company reaffirmed its presence in extreme sports by renewing sponsorships, becoming the official action camera for the X Games, Freeride World Tour, and Vans Pipe Masters surf contest. Recognition from Outside Magazine in November 2023 as one of the 50 Best Places to Work for the third consecutive year capped off a mix of financial challenges and strategic triumphs for GoPro.
Technical Observation (on the daily chart)
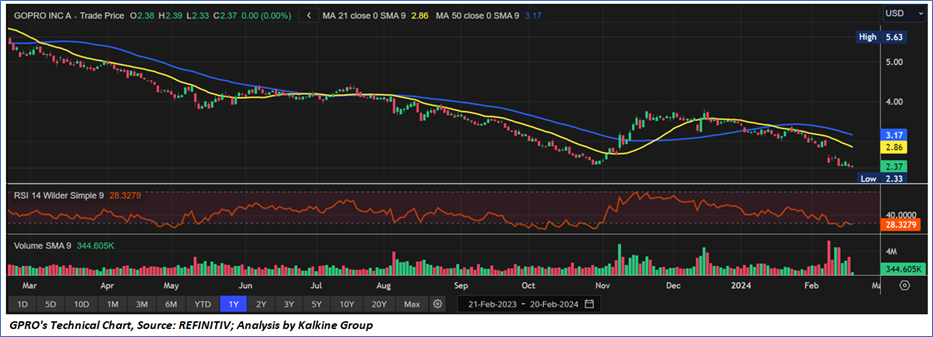
The Relative Strength Index (RSI), calculated over a 14-day span, stands at 28.33, currently in the over-sold zone, signifying the likelihood of either some consolidation or a trend reversal towards the upside from the current key support levels. Adding to this, the stock presently finds itself positioned below both the 21-day and 50-day Simple Moving Averages (SMA), which could function as a dynamic short-term resistance levels.
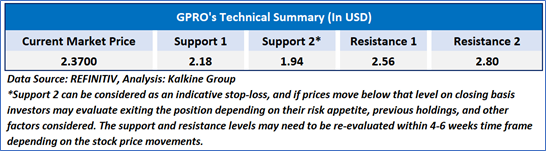
As per the above-mentioned price action, recent key business and financial updates, momentum in the stock over the last month, and technical indicators analysis, a ‘Speculative Buy’ rating has been given to GoPro, Inc. (NASDAQ: GPRO) at the current market price of USD 2.37, as of February 20, 2024, at 07:15 am PST.
Individuals can evaluate the stock based on the support and resistance levels provided in the report in case of keen interest taking into consideration the risk-reward scenario.
Markets are trading in a highly volatile zone currently due to certain macro-economic issues and prevailing geopolitical tensions. Therefore, it is prudent to follow a cautious approach while investing.
How to Read the Charts?
The yellow colour line reflects the 21-period simple moving average (SMA) while the blue line indicates the 50- period simple moving average (SMA). SMA helps to identify existing price trends. If the prices are trading above the 21-period and 50-period moving average, then it shows prices are currently trading in a bullish trend.
The orange colour line in the chart’s lower segment reflects the Relative Strength Index (14-Period) which indicates price momentum and signals momentum in trend. A reading of 70 or above suggests overbought status while a reading of 30 or below suggests an oversold status.
The red and green colour bars in the chart’s lower segment show the volume of the stock. The volume is the number of shares that changed hands during a given day. Stocks with high volumes are more liquid than stocks with lesser volume as liquidity in stocks helps with easier and faster execution of the order.
The Orange colour lines are the trend lines drawn by connecting two or more price points and used for trend identification purposes. The trend line also acts as a line of support and resistance.
Technical Indicators Defined: -
Support: A level at which the stock prices tend to find support if they are falling, and a downtrend may take a pause backed by demand or buying interest. Support 1 refers to the nearby support level for the stock and if the price breaches the level, then Support 2 may act as the crucial support level for the stock.
Resistance: A level at which the stock prices tend to find resistance when they are rising, and an uptrend may take a pause due to profit booking or selling interest. Resistance 1 refers to the nearby resistance level for the stock and if the price surpasses the level, then Resistance 2 may act as the crucial resistance level for the stock.
Stop-loss: It is a level to protect further losses in case of unfavourable movement in the stock prices.
Abbreviations
CMP: Current Market Price
SMA: Simple Moving Average
RSI: Relative Strength Index
USD: United States dollar
Note 1: Past performance is not a reliable indicator of future performance.
Note 2: The reference date for all price data, currency, technical indicators, support, and resistance levels is February 20, 2024. The reference data in this report has been partly sourced from REFINITIV.
Note 3: Investment decisions should be made depending on an individual's appetite for upside potential, risks, holding duration, and any previous holdings. An 'Exit' from the stock can be considered if the Target Price mentioned as per the Valuation and or the technical levels provided has been achieved and is subject to the factors discussed above.
Note 4: The report publishing date is as per the Pacific Time Zone.
Kalkine Equities LLC provides general information about companies and their securities. The information contained in the reports, including any recommendations regarding the value of or transactions in any securities, does not take into account any of your investment objectives, financial situation or needs. Kalkine Equities LLC is not registered as an investment adviser in the U.S. with either the federal or state government. Before you make a decision about whether to invest in any securities, you should take into account your own objectives, financial situation and needs and seek independent financial advice. All information in our reports represents our views as at the date of publication and may change without notice.
Kalkine Media LLC, an affiliate of Kalkine Equities LLC, may have received, or be entitled to receive, financial consideration in connection with providing information about certain entity(s) covered on its website.
 US
US  AU
AU UK
UK CA
CA NZ
NZ Please wait processing your request...