
GoPro, Inc.
GoPro, Inc. (NASDAQ: GPRO) manufactures cameras along with mountable and wearable accessories. The company offers a range of flagship models, including its cloud-connected HERO12 Black, HERO11 Black, HERO11 Black Mini, HERO10 Black, HERO10 Black Bones, HERO9 Black, and MAX cameras.
Recommendation Rationale – SELL at USD 1.08
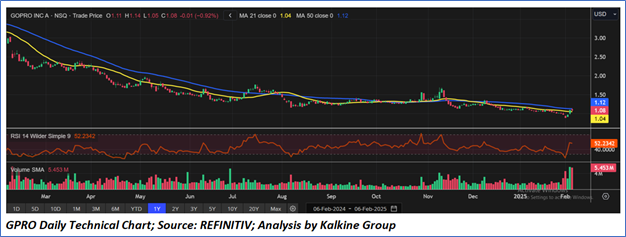
GPRO’s Daily Price Chart
Valuation Methodology: Price/Earnings Approach (FY Dec'25E) (Illustrative)
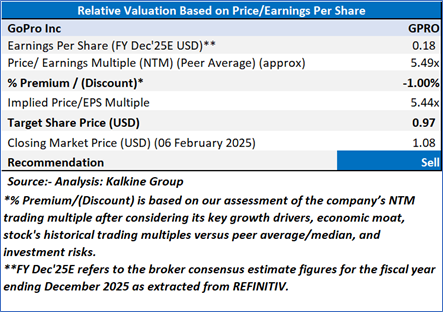
GoPro is expected to trade at a discount amid its financial struggles in 2024, with revenue plunging 20% year-over-year to USD 801 million and a sharp 32% decline in Q4 sales. Net losses skyrocketed to USD 432 million from USD 53 million in 2023, while operating losses widened due to rising expenses. Despite a focus on high-end cameras, demand weakened, with unit sales dropping 16%. A USD 295 million tax valuation adjustment further worsened financials, highlighting GoPro’s ongoing challenges in profitability, market positioning, and operational efficiency.
Given its current trading levels, downside indicated by valuation, and risks associated, it is prudent to book profit at the current levels. Hence, a ‘Sell’ recommendation is given on the stock at the closing price of USD 1.08, as of February 06, 2025.
Markets are trading in a highly volatile zone currently due to certain macro-economic issues and geopolitical issues prevailing geopolitical tensions. Therefore, it is prudent to follow a cautious approach while investing.
Note 1: Past performance is neither an indicator nor a guarantee of future performance.
Note 2: The reference date for all price data, currency, technical indicators, support, and resistance levels is February 06, 2025. The reference data in this report has been partly sourced from REFINITIV.
Note 3: Investment decisions should be made depending on an individual's appetite for upside potential, risks, holding duration, and any previous holdings. An 'Exit' from the stock can be considered if the Target Price mentioned as per the Valuation and or the technical levels provided has been achieved and is subject to the factors discussed above.
Technical Indicators Defined: -
Support: A level at which the stock prices tend to find support if they are falling, and downtrend may take a pause backed by demand or buying interest.
Resistance: A level at which the stock prices tend to find resistance when they are rising, and uptrend may take a pause due to profit booking or selling interest.
Stop-loss: In general, it is a level to protect further losses in case of any unfavourable movement in the stock prices.
Kalkine Equities LLC, with Delaware File Number 4697384, Foreign Qualification Registration in California File Number 202109211078, and Texas File Number 805521396, is authorized to provide general advice only. The information on https://kalkine.com/ does not take into account any of your investment objectives, financial situation or needs. You should consider the appropriateness of advice taking into account your own objectives, financial situation and needs and seek independent financial advice before making any financial decisions. The link to our Terms and Conditions and Privacy Policy has been provided for your reference. On the date of publishing the reports (mentioned on the website), employees and/or associates of Kalkine do not hold positions in any of the stocks covered on the website. These stocks can change any time and readers of the reports should not consider these stocks as advice or recommendations later.
Past performance is not a reliable indicator of future performance.
 Please wait processing your request...