MSFT 417.14 0.9731% AAPL 229.0 -0.3438% NVDA 119.37 1.5137% GOOGL 163.38 0.989% GOOG 165.11 1.0465% AMZN 178.5 3.7067% META 521.31 0.5963% AVGO 162.82 3.7533% TSLA 214.11 3.7958% TSM 171.7 1.5075% LLY 960.02 2.1081% V 276.37 0.7473% JPM 224.8 1.1656% UNH 590.2 -0.2316% NVO 139.16 1.1926% WMT 77.23 1.0599% LVMUY 149.005 -0.3844% XOM 117.94 -0.1608% LVMHF 745.0 -0.4011% MA 483.34 0.5283%

Hut 8 Corporation
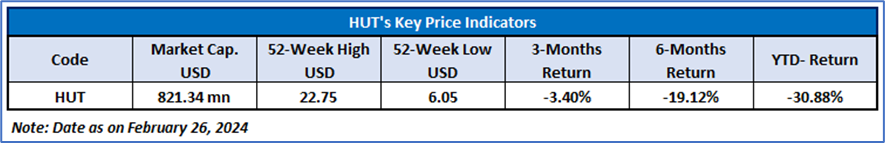
Hut 8 Corp. (NASDAQ: HUT) is a data mining company. The Company provides the infrastructure and solutions in the global technology ecosystem. The Company is engaged in Bitcoin mining and hosting, managed services, energy arbitrage, operating traditional data centers, and utilizing emerging technologies, such as artificial intelligence (AI) and machine learning. It operates computing infrastructure across its sites that mines Bitcoin and delivers cloud, colocation, and high-performance computing services to its enterprise customers.
Technical Observation (on the daily chart)
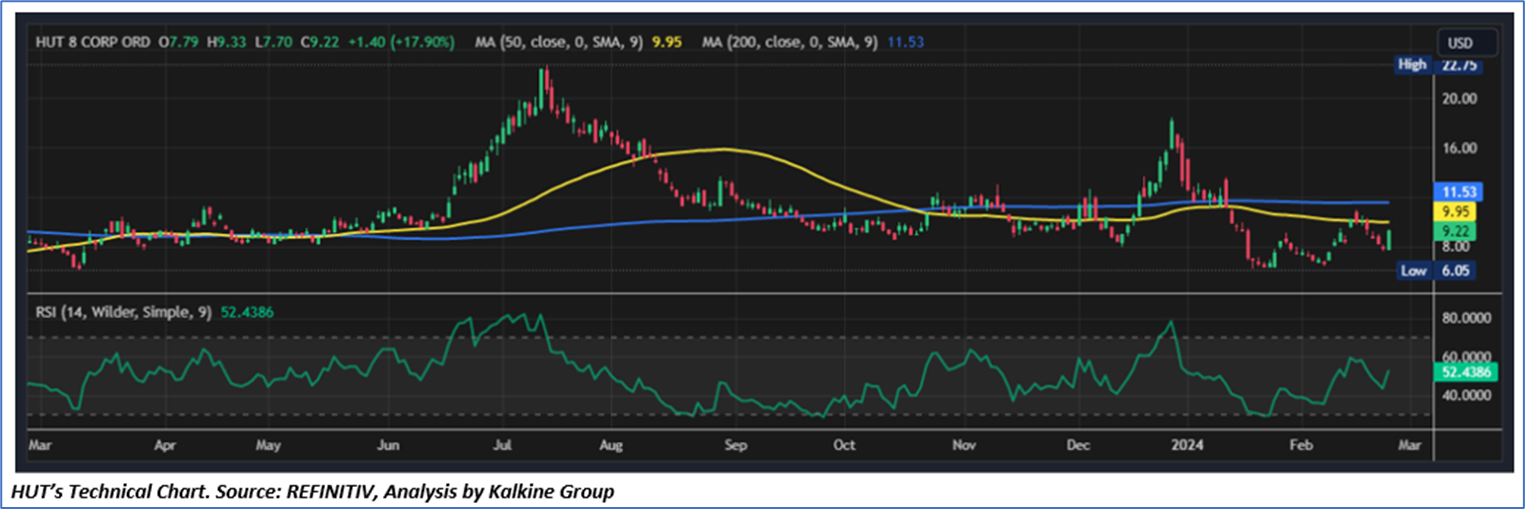
On daily price chart, HUT’s shares registered a Bullish Marubozu candle and ended ~18% higher on 26th February 2024. The Bullish Marubozu was backed by above 20-D above average volume traded on the exchange. The leading momentum indicator the Moving Average Convergence Divergence (MACD) is rising and trading above 9-D SMA signal line another bullish indication. Further, 14-D Relative Strength Index (RSI) hovering in neutral zone with slight bullish bias. The stock closed above its crucial short-term support level of 50-D EMA. However, the long-term trend is still bearish as stock traded well below its long-term exponential moving averages of 200-D and 100-D.
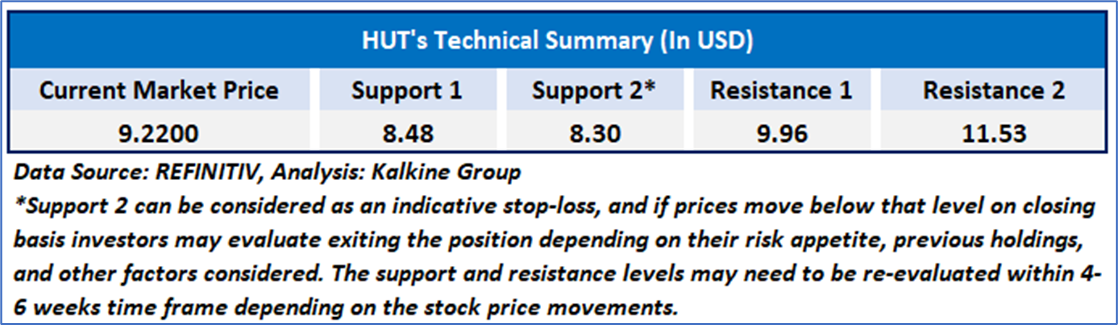
As per the above-mentioned price action, recent key business and financial updates, momentum in the stock over the last month, and technical indicators analysis, a ‘Speculative Buy’ rating has been given to Hut 8 Corp. (NASDAQ: HUT) at the closing price of USD 9.22 as of February 26, 2024.
 Individuals can evaluate the stock based on the support and resistance levels provided in the report in case of keen interest taking into consideration the risk-reward scenario.
Markets are trading in a highly volatile zone currently due to certain macro-economic issues and prevailing geopolitical tensions. Therefore, it is prudent to follow a cautious approach while investing.
Related Risk: This report may be looked at from a high-risk perspective and a recommendation is provided for a short duration. This report is solely based on technical parameters, and the fundamental performance of the stocks has not been considered in the decision-making process. Other factors which could impact the stock prices include market risks, regulatory risks, interest rates risks, currency risks, social and political instability risks etc.
How to Read the Charts?
The yellow colour line reflects the 21-period simple moving average (SMA) while the blue line indicates the 50- period simple moving average (SMA). SMA helps to identify existing price trends. If the prices are trading above the 21-period and 50-period moving average, then it shows prices are currently trading in a bullish trend.
The orange colour line in the chart’s lower segment reflects the Relative Strength Index (14-Period) which indicates price momentum and signals momentum in trend. A reading of 70 or above suggests overbought status while a reading of 30 or below suggests an oversold status.
The red and green colour bars in the chart’s lower segment show the volume of the stock. The volume is the number of shares that changed hands during a given day. Stocks with high volumes are more liquid than stocks with lesser volume as liquidity in stocks helps with easier and faster execution of the order.
The Orange colour lines are the trend lines drawn by connecting two or more price points and used for trend identification purposes. The trend line also acts as a line of support and resistance.
Technical Indicators Defined: -
Support: A level at which the stock prices tend to find support if they are falling, and a downtrend may take a pause backed by demand or buying interest. Support 1 refers to the nearby support level for the stock and if the price breaches the level, then Support 2 may act as the crucial support level for the stock.
Resistance: A level at which the stock prices tend to find resistance when they are rising, and an uptrend may take a pause due to profit booking or selling interest. Resistance 1 refers to the nearby resistance level for the stock and if the price surpasses the level, then Resistance 2 may act as the crucial resistance level for the stock.
Stop-loss: It is a level to protect further losses in case of unfavourable movement in the stock prices.
Abbreviations
CMP: Current Market Price
SMA: Simple Moving Average
RSI: Relative Strength Index
USD: United States dollar
Note: Trading decisions require a thorough analysis by individual. Technical reports in general chart out metrics that may be assessed by individuals before any stock evaluation. The above are illustrative analytical factors used for evaluating the stocks; other parameters can be looked at along with additional risks per se. Past performance is neither an indicator nor a guarantee of future performance.
Note 1: Past performance is not a reliable indicator of future performance.
Note 2: The reference date for all price data, currency, technical indicators, support, and resistance level is February 26, 2024. The reference data in this report has been partly sourced from REFINITIV.
Note 3: Investment decisions should be made depending on an individual's appetite for upside potential, risks, holding duration, and any previous holdings. An 'Exit' from the stock can be considered if the Target Price mentioned as per the Valuation and or the technical levels provided has been achieved and is subject to the factors discussed above.
Note 4: Target Price refers to a price level that the stock is expected to reach as per the relative valuation method and or technical analysis taking into consideration both short-term and long-term scenarios.
Note 5: ‘Kalkine reports are prepared based on the stock prices captured either from the New York Stock Exchange (NYSE), NASDAQ Capital Markets (NASDAQ), and or REFINITIV. Typically, all sources (NYSE, NASDAQ, or REFINITIV) may reflect stock prices with a delay which could be a lag of 15-20 minutes. There can be no assurance that future results or events will be consistent with the information provided in the report. The information is subject to change without any prior notice.’
Kalkine Equities LLC provides general information about companies and their securities. The information contained in the reports, including any recommendations regarding the value of or transactions in any securities, does not take into account any of your investment objectives, financial situation or needs. Kalkine Equities LLC is not registered as an investment adviser in the U.S. with either the federal or state government. Before you make a decision about whether to invest in any securities, you should take into account your own objectives, financial situation and needs and seek independent financial advice. All information in our reports represents our views as at the date of publication and may change without notice.
Kalkine Media LLC, an affiliate of Kalkine Equities LLC, may have received, or be entitled to receive, financial consideration in connection with providing information about certain entity(s) covered on its website.
 US
US  AU
AU UK
UK CA
CA NZ
NZ Please wait processing your request...