AAPL 209.68 -3.3644% MSFT 378.77 -1.1741% NVDA 115.58 -0.1382% GOOGL 162.76 -2.6031% GOOG 164.73 -2.5266% AMZN 193.89 -2.514% META 590.64 -4.6678% AVGO 191.36 -1.4776% LLY 801.65 -2.4591% TSLA 240.68 -2.9868% TSM 171.59 -3.1495% V 328.55 -1.2889% JPM 225.19 -1.1891% UNH 481.52 0.0852% NVO 75.89 1.4708% WMT 84.5 -0.8216% LVMUY 129.76 -2.7942% XOM 108.67 -0.4215% LVMHF 655.0 -2.0693% MA 519.83 -0.9168%


Section1: Company Overview
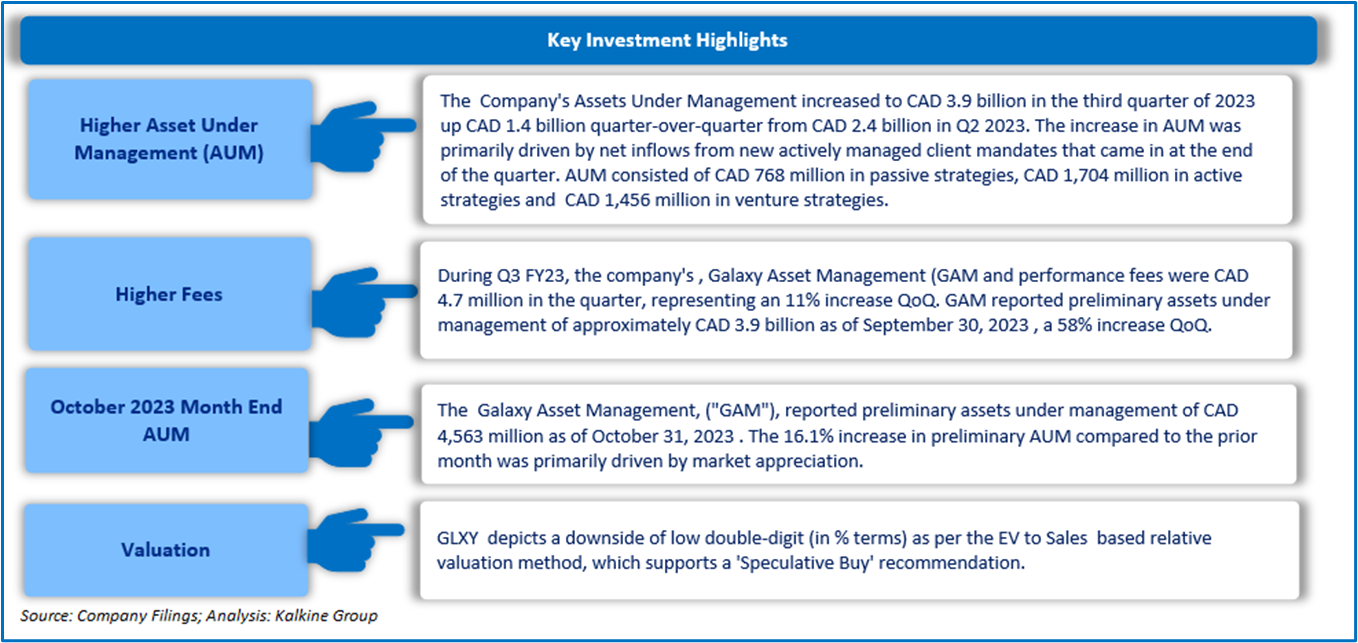
Galaxy Digital Holdings Ltd (TSX: GLXY) is a is a diversified financial services and investment management company dedicated to the digital assets and blockchain technology industry. The company operates through five business lines: Trading, Principal investing, Asset management, mining, and Investment Banking. This Report covers the Investment Highlights, Key Financial Metrics, Risks, Technical Analysis along with the Valuation, Target Price, and Recommendation on the stock.
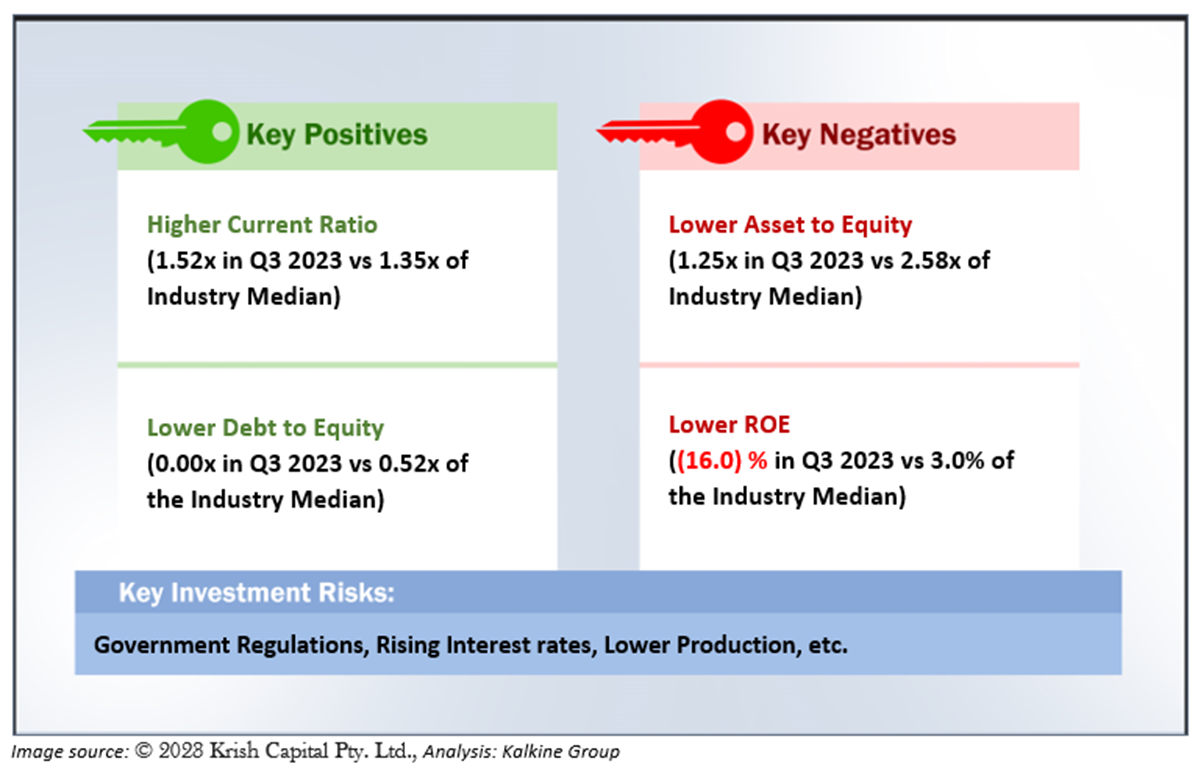
1.1 The Key Positives, Negatives, Investment Highlights, and Risks
Section2: Financial Highlights
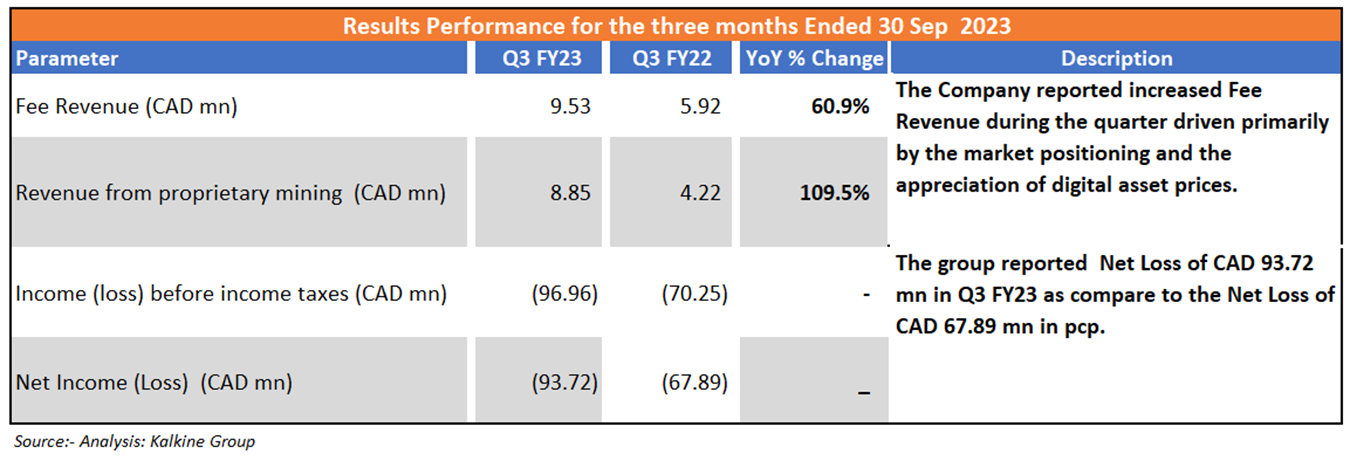
2.1 Key Financial Highlights
Section 3: Stock Recommendation Summary
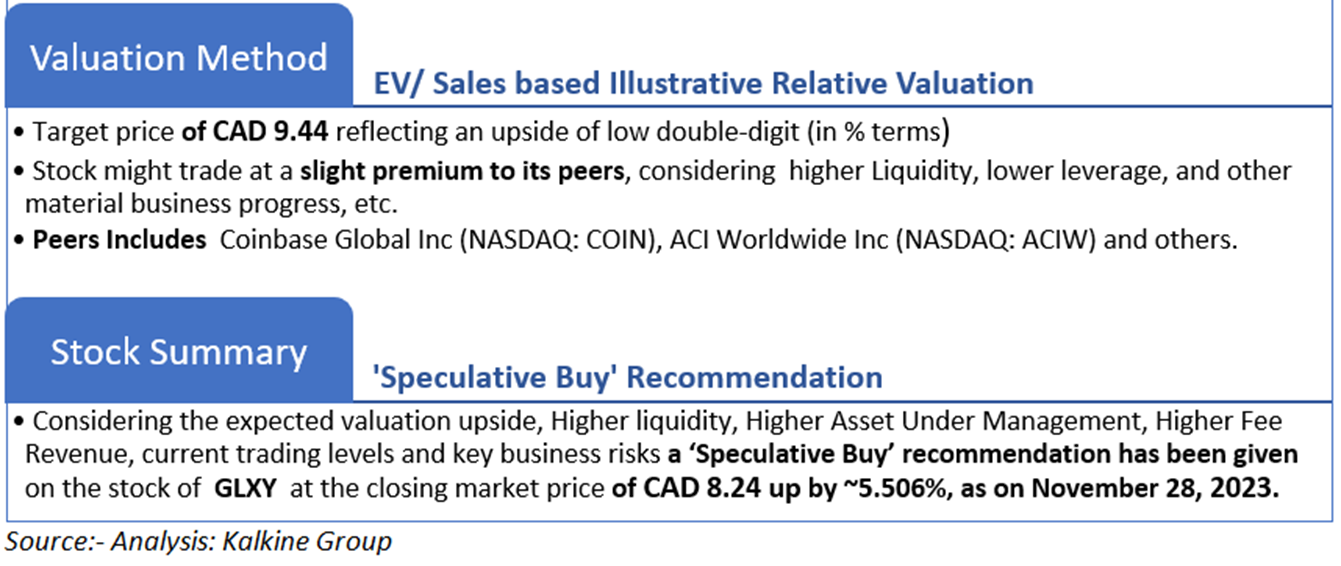
3.1 Valuation Methodology
Valuation Methodology (Illustrative): EV to Sales based

3.2 Price Performance and Stock Recommendation

The stock has witnessed an upside of ~30.17% in 1 month and ~48.73% over the last 3 months. Moreover, the stock is trading below the average 52-week high price of CAD 8.60 and 52-week low price of CAD 3.325 providing an opportunity to accumulate the stock.
3.3 One-Year Technical Price Chart
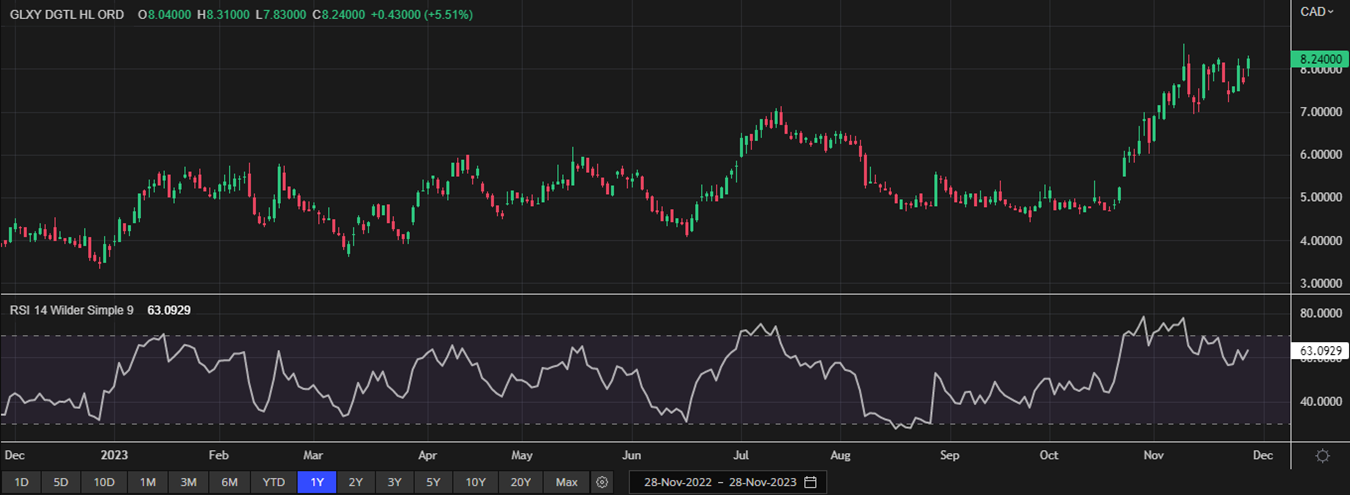
One-Year Technical Price Chart (as of November 28, 2023). Source: REFINITIV, Analysis: Kalkine Group
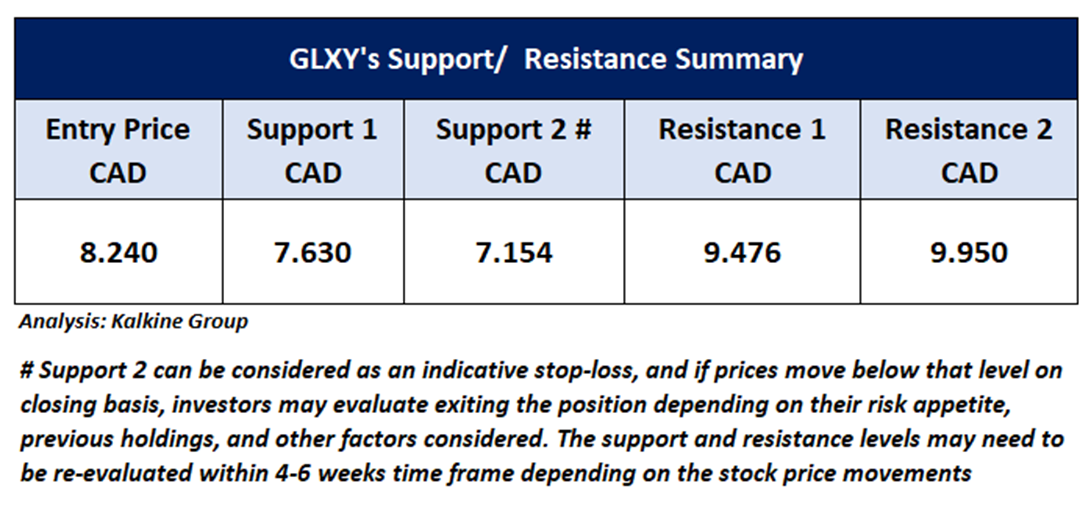
3.4 Technical Summary
Note 1: Past performance is not a reliable indicator of future performance.
Note 2: The reference date for all price data, currency, technical indicators, support, and resistance levels as on November 28, 2023. The reference data in this report has been partly sourced from REFINITIV.
Note 3: Investment decisions should be made depending on an individual's appetite for upside potential, risks, holding duration, and any previous holdings. An 'Exit' from the stock can be considered if the Target Price mentioned as per the Valuation and or the technical levels provided has been achieved and is subject to the factors discussed above.
Technical Indicators Defined: -
Support: A level at which the stock prices tend to find support if they are falling, and a downtrend may take a pause backed by demand or buying interest.
Resistance: A level at which the stock prices tend to find resistance when they are rising, and the uptrend may take a pause due to profit booking or selling interest.
Stop-loss: In general, it is a level to protect further losses in case of any unfavourable movement in the stock prices.
Kalkine Equities LLC provides general information about companies and their securities. The information contained in the reports, including any recommendations regarding the value of or transactions in any securities, does not take into account any of your investment objectives, financial situation or needs. Kalkine Equities LLC is not registered as an investment adviser in the U.S. with either the federal or state government. Before you make a decision about whether to invest in any securities, you should take into account your own objectives, financial situation and needs and seek independent financial advice. All information in our reports represents our views as at the date of publication and may change without notice.
Kalkine Media LLC, an affiliate of Kalkine Equities LLC, may have received, or be entitled to receive, financial consideration in connection with providing information about certain entity(s) covered on its website.
 US
US  AU
AU UK
UK CA
CA NZ
NZ Please wait processing your request...