
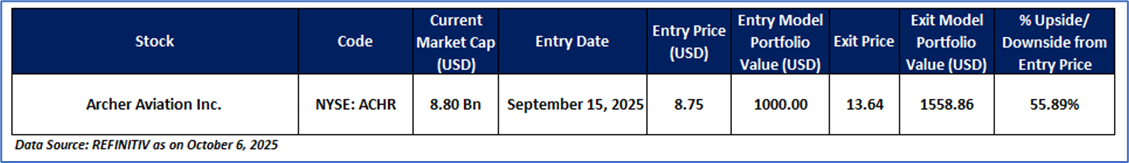
Archer Aviation Inc. (NYSE: ACHR)
Archer Aviation Inc. (NYSE: ACHR) is an aerospace company. It is engaged in providing customers with advanced aircraft and related technologies and services in the United States and internationally in both the commercial and defence sectors.
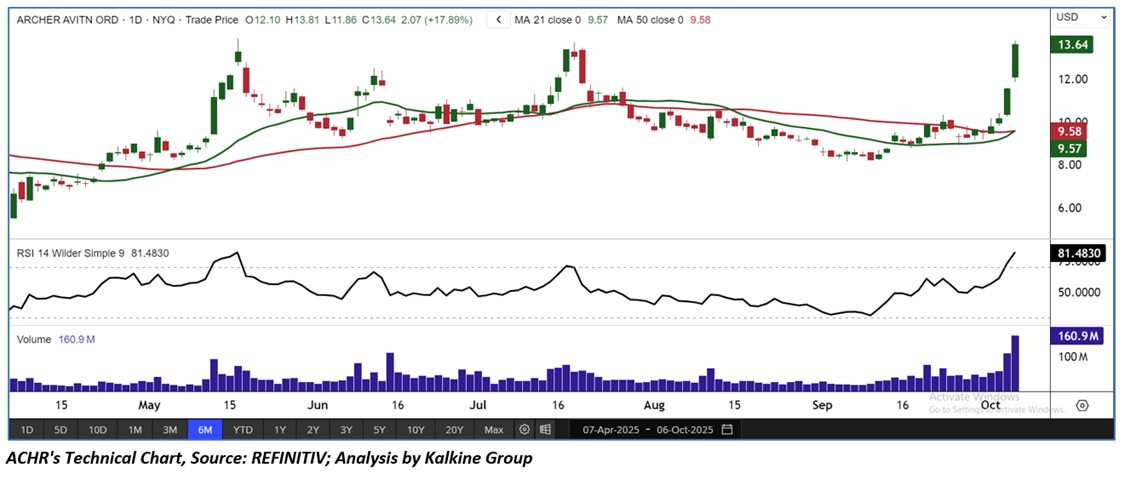
ACHR has been a part of the Momentum Model Portfolio' since Sep 15, 2025. Therefore, an 'Exit' stance from the Momentum Model Portfolio is recommended on stock at the close market price of USD 13.64 as on Oct 6, 2025.
ACHR’s Daily Chart
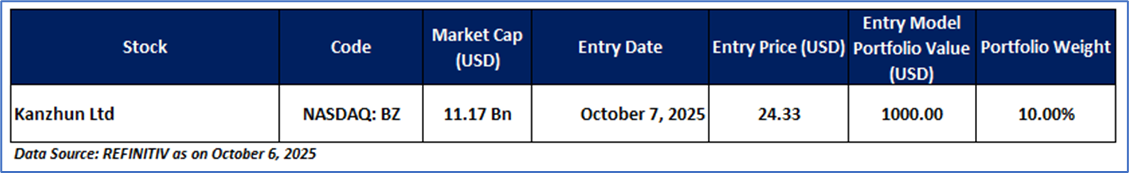
New Entry Case: Kanzhun Ltd (NASDAQ: BZ)
Kanzhun Ltd (NASDAQ: BZ) is a holding company principally engaged in the provision of recruitment and job-hunting services. The Company connects job seekers and enterprise users mainly through its interactive BOSS Zhipin mobile app.
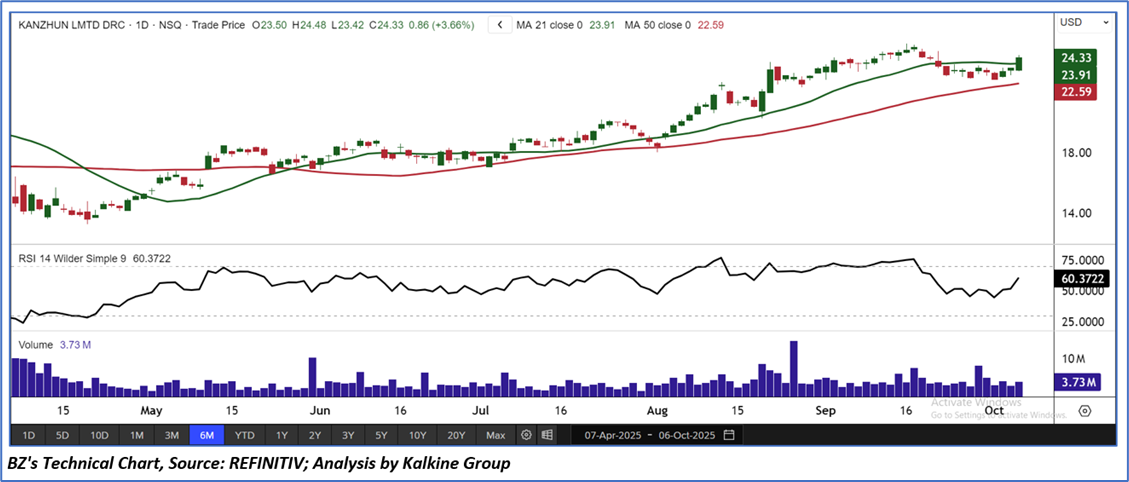
Technical Analysis: BZ's price is currently maintaining strong support levels on the daily chart and has recently moved higher, indicating a possible upward shift in the near term. The 14-period RSI remains above the midpoint, signaling a potential rebound and growing buying interest. Given the company's history of resilience and stability, the outlook for a sustained upward trend appears favorable, with the potential to retest previous highs. With ongoing momentum, BZ's stock is well-positioned to capitalize on its current trend and achieve short-term gains.
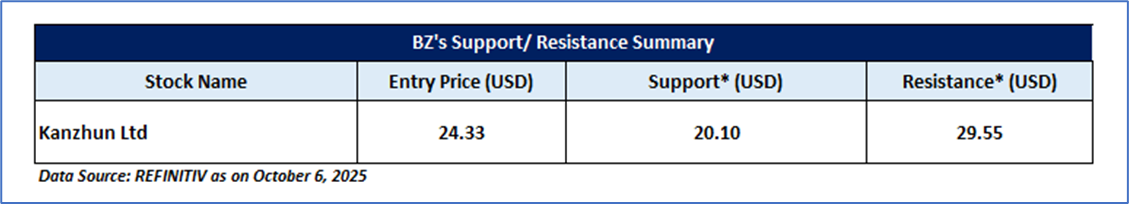
BZ is recommended as a new entry in the 'Momentum Model Portfolio' as on October 7, 2025. Considering technical analysis, support and resistance levels, an 'Entry' is recommended in the 'Momentum Model Portfolio' at the close market price of USD 24.33 as on October 6, 2025.
BZ’s Daily Chart
Support and Resistance Summary

Note 1: Past performance is neither an Indicator nor a guarantee of future performance.
Note 2: The reference date for all price data, and currency as of October 6, 2025. The reference data in this report has been partly sourced from REFINITIV.
Note 3: Investment decisions should be made depending on an individual's appetite for upside potential, risks, holding duration, and any previous holdings.
Disclaimer
This information should not be relied upon as personal financial advice by Kalkine on (i) the stocks or (ii) the use or suitability of the model portfolios. Only an investor knows about their circumstances to make an investment decision.
Model Portfolio has been prepared for illustrative purpose only and does not take into account the objectives, financial situation or needs of any particular investor. Accordingly, investors should, before acting on the information, consider its appropriateness, having regard to their objectives, financial situation and needs. Past performance is not necessarily indicative of future performance results. Actual investment returns will vary, and the value of investments can go up or down.
Kalkine Equities LLC, with Delaware File Number 4697384, Foreign Qualification Registration in California File Number 202109211078, and Texas File Number 805521396, is authorized to provide general advice only. The information on https://kalkine.com/ does not take into account any of your investment objectives, financial situation or needs. You should consider the appropriateness of advice taking into account your own objectives, financial situation and needs and seek independent financial advice before making any financial decisions. The link to our Terms and Conditions and Privacy Policy has been provided for your reference. On the date of publishing the reports (mentioned on the website), employees and/or associates of Kalkine do not hold positions in any of the stocks covered on the website. These stocks can change any time and readers of the reports should not consider these stocks as advice or recommendations later.
Past performance is not a reliable indicator of future performance.
 Please wait processing your request...