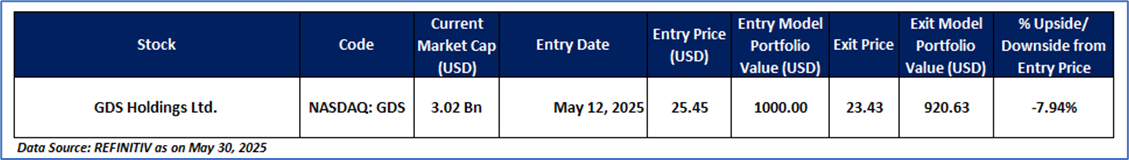
Exit Case: GDS Holdings Ltd. (NASDAQ: GDS)
GDS Holdings Ltd. (NASDAQ: GDS) engages in developing and operating data centers in China. It builds, operates, and transfers data centers at other locations. GDS has been a part of the 'Momentum Model Portfolio' since May 12, 2025. Therefore, an 'Exit' stance from the Momentum Model Portfolio is recommended on the stock at the current market price of USD 23.43 as on May 30, 2025 (7:00 am PDT).
GDS’s Daily Chart
_05_30_2025_16_04_17_221043.png)
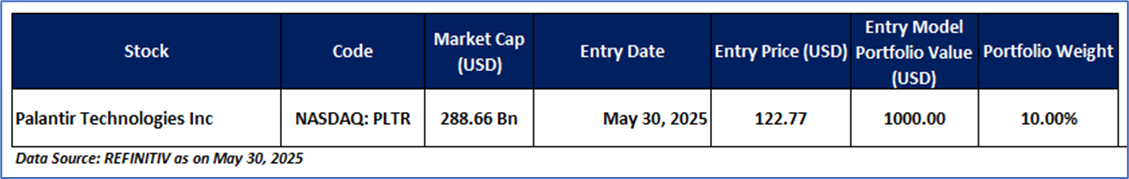
New Entry Case: Palantir Technologies Inc (NASDAQ: PLTR)
Palantir Technologies Inc (NASDAQ: PLTR) develops software designed to support counterterrorism investigations and operations. The company offers four main platforms: Palantir Gotham, Palantir Foundry, Palantir Apollo, and the Palantir Artificial Intelligence Platform (AIP).
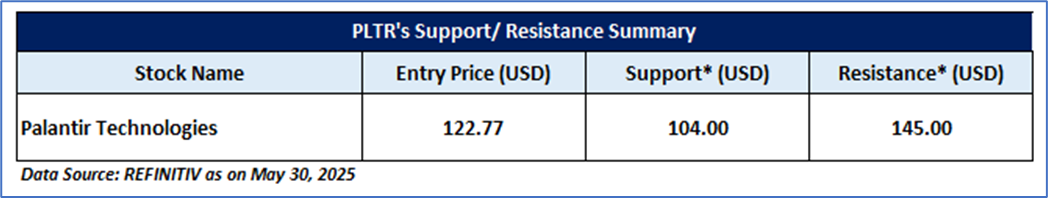
Technical Analysis: On the daily chart, PLTR's price is maintaining key support levels, indicating a potential upward reversal in the near future. The 14-period RSI remains above the midpoint, suggesting a possible bounce and the emergence of buying momentum. Given the company's resilience and stability, the prospects for a sustained upward trend increase, raising the likelihood of retesting previous highs. The stock appears well positioned to capitalize on its momentum and achieve short-term gains.
PLTR is recommended as a new entry in the 'Momentum Model Portfolio' as on May 30, 2025. Considering technical analysis, support and resistance levels, an 'Entry' is recommended in the 'Momentum Model Portfolio' at the current market price of USD 122.77 as on May 30, 2025 (7:00 am PDT).
PLTR’s Daily Chart
_05_30_2025_16_04_52_002524.png)
Support and Resistance Summary
Note 1: Past performance is neither an Indicator nor a guarantee of future performance.
Note 2: The reference date for all price data, and currency as of May 30, 2025. The reference data in this report has been partly sourced from REFINITIV.
Note 3: Investment decisions should be made depending on an individual's appetite for upside potential, risks, holding duration, and any previous holdings.
Disclaimer
This information should not be relied upon as personal financial advice by Kalkine on (i) the stocks or (ii) the use or suitability of the model portfolios. Only an investor knows about their circumstances to make an investment decision.
Model Portfolio has been prepared for illustrative purpose only and does not take into account the objectives, financial situation or needs of any particular investor. Accordingly, investors should, before acting on the information, consider its appropriateness, having regard to their objectives, financial situation and needs. Past performance is not necessarily indicative of future performance results. Actual investment returns will vary, and the value of investments can go up or down.
Kalkine Equities LLC, with Delaware File Number 4697384, Foreign Qualification Registration in California File Number 202109211078, and Texas File Number 805521396, is authorized to provide general advice only. The information on https://kalkine.com/ does not take into account any of your investment objectives, financial situation or needs. You should consider the appropriateness of advice taking into account your own objectives, financial situation and needs and seek independent financial advice before making any financial decisions. The link to our Terms and Conditions and Privacy Policy has been provided for your reference. On the date of publishing the reports (mentioned on the website), employees and/or associates of Kalkine do not hold positions in any of the stocks covered on the website. These stocks can change any time and readers of the reports should not consider these stocks as advice or recommendations later.
Past performance is not a reliable indicator of future performance.
 Please wait processing your request...