SolarEdge Technologies, Inc
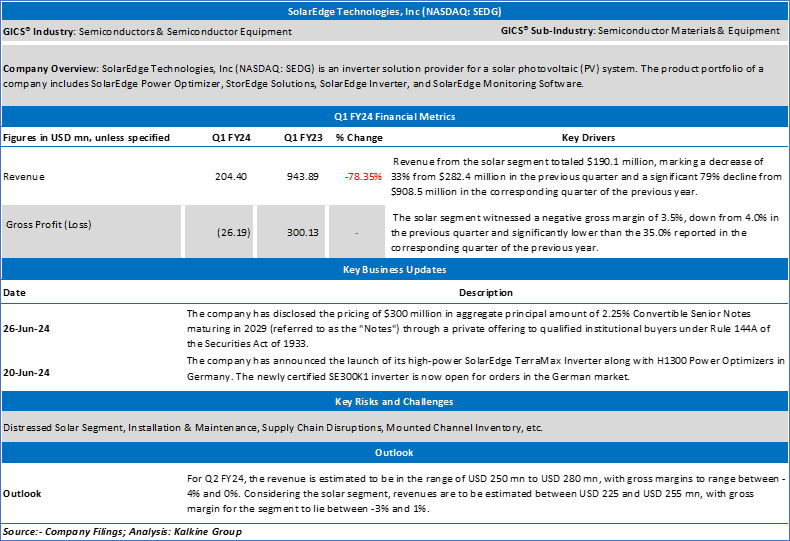
SolarEdge Technologies, Inc (NASDAQ: SEDG) is an inverter solution provider for a solar photovoltaic (PV) system. The product portfolio of a company includes SolarEdge Power Optimizer, StorEdge Solutions, SolarEdge Inverter, and SolarEdge Monitoring Software. This Report covers the Key Financial Metrics, Risks, and Technical Analysis along with the Valuation, Target Price, and Recommendation on the stock.
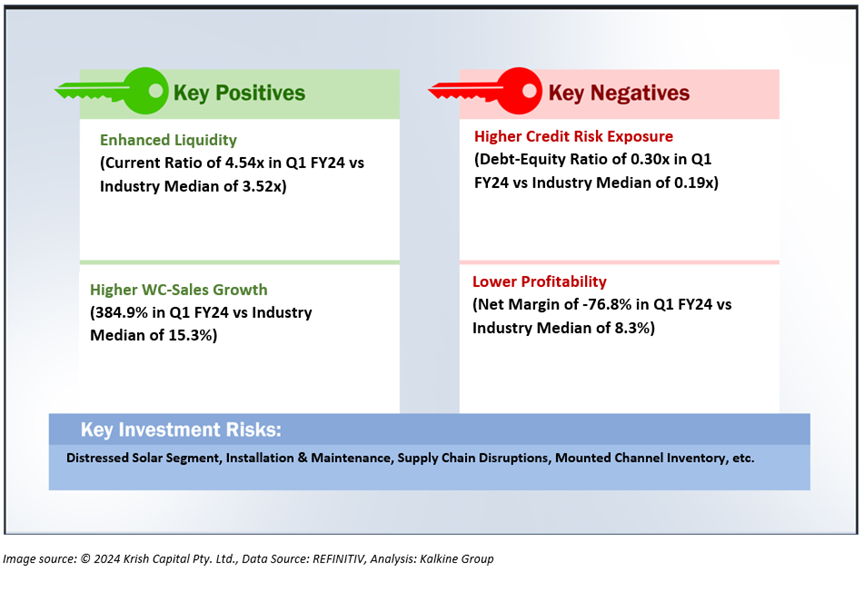
Section 1.0: Key Metrics in Pictures

Having looked at the key financial metrics above, the below sections provide an in-depth fundamental and technical analysis on a Semiconductor Equipment Stock along with recommendations, technical support and resistance levels and indicative stop-loss.
Section 2.0: SolarEdge Technologies, Inc (NASDAQ: SEDG) (Speculative Buy at USD 25.05, closing market price of 05 July 2024)
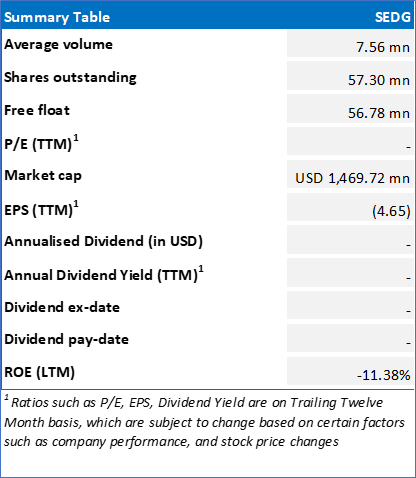
2.1 Company Details
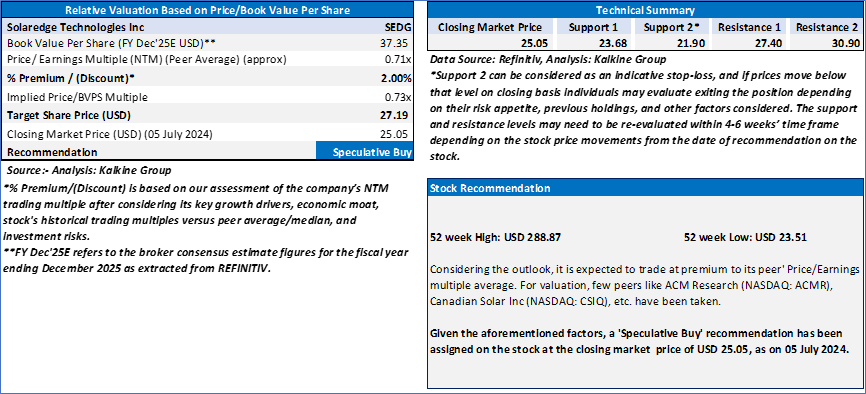
2.2 Valuation and Technical Guidance
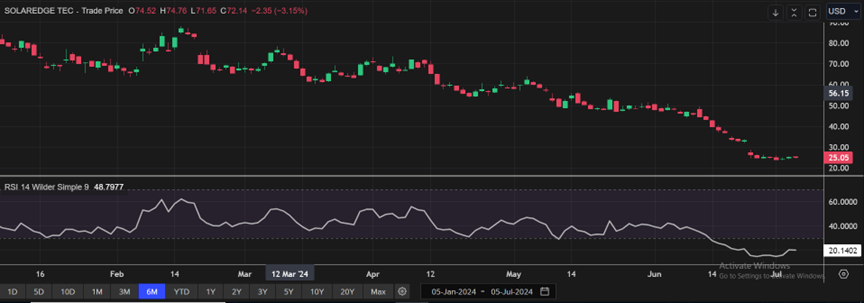
SEDG’s Daily Chart; Analysis: REFINITIV
Technical Commentary
SEDG's daily chart shows a potential reversal pattern with a white candle, suggesting potential upside momentum. The RSI (14-period) at 20.14 indicates oversold conditions, likely prompting a bounce back. Prices are currently below the 50-period SMA, acting as support. Key support levels are at 23.68 and 21.90, with resistance levels at 27.40 and 30.90.
Please note markets are trading in a highly volatile zone currently due to certain macro-economic and geopolitical tensions prevailing. Therefore, it is prudent to follow a cautious approach while investing.
SEDG is a part of Global Fully Charged Report.
Note 1: Past performance is not a reliable indicator of future performance.
Note 2: The reference date for all price data, currency, technical indicators, support, and resistance level is 05 July 2024. The reference data in this report has been partly sourced from REFINITIV.
Note 3: Investment decisions should be made depending on an individual's appetite for upside potential, risks, holding duration, and any previous holdings. An 'Exit' from the stock can be considered if the Target Price mentioned as per the Valuation and or the technical levels provided has been achieved and is subject to the factors discussed above.
Note 4: Target Price refers to a price level which the stock is expected to reach as per the relative valuation method and/ or technical analysis taking into consideration both short-term and long-term scenarios.
Note 5: ‘Kalkine reports are prepared based on the stock prices captured either from the London Stock Exchange (LSE) and or REFINITIV. Typically, both sources (LSE and or REFINITIV) may reflect stock prices with a delay which could be a lag of 15-20 minutes. There can be no assurance that future results or events will be consistent with the information provided in the report. The information is subject to change without any prior notice.’
Note 6: Dividend Yield may vary as per the stock price movement.
Technical Indicators Defined: -
Support: A level at which the stock prices tend to find support if they are falling, and a downtrend may take a pause backed by demand or buying interest. Support 1 refers to the nearby support level for the stock and if the price breaches the level, then Support 2 may act as the crucial support level for the stock.
Resistance: A level at which the stock prices tend to find resistance when they are rising, and an uptrend may take a pause due to profit booking or selling interest. Resistance 1 refers to the nearby resistance level for the stock and if the price surpasses the level, then Resistance 2 may act as the crucial resistance level for the stock.
Stop-loss: It is a level to protect further losses in case of unfavourable movement in the stock prices.
Kalkine Equities LLC provides general information about companies and their securities. The information contained in the reports, including any recommendations regarding the value of or transactions in any securities, does not take into account any of your investment objectives, financial situation or needs. Kalkine Equities LLC is not registered as an investment adviser in the U.S. with either the federal or state government. Before you make a decision about whether to invest in any securities, you should take into account your own objectives, financial situation and needs and seek independent financial advice. All information in our reports represents our views as at the date of publication and may change without notice.
Kalkine Media LLC, an affiliate of Kalkine Equities LLC, may have received, or be entitled to receive, financial consideration in connection with providing information about certain entity(s) covered on its website.
Past performance is not a reliable indicator of future performance.
 Please wait processing your request...