GrafTech International Ltd
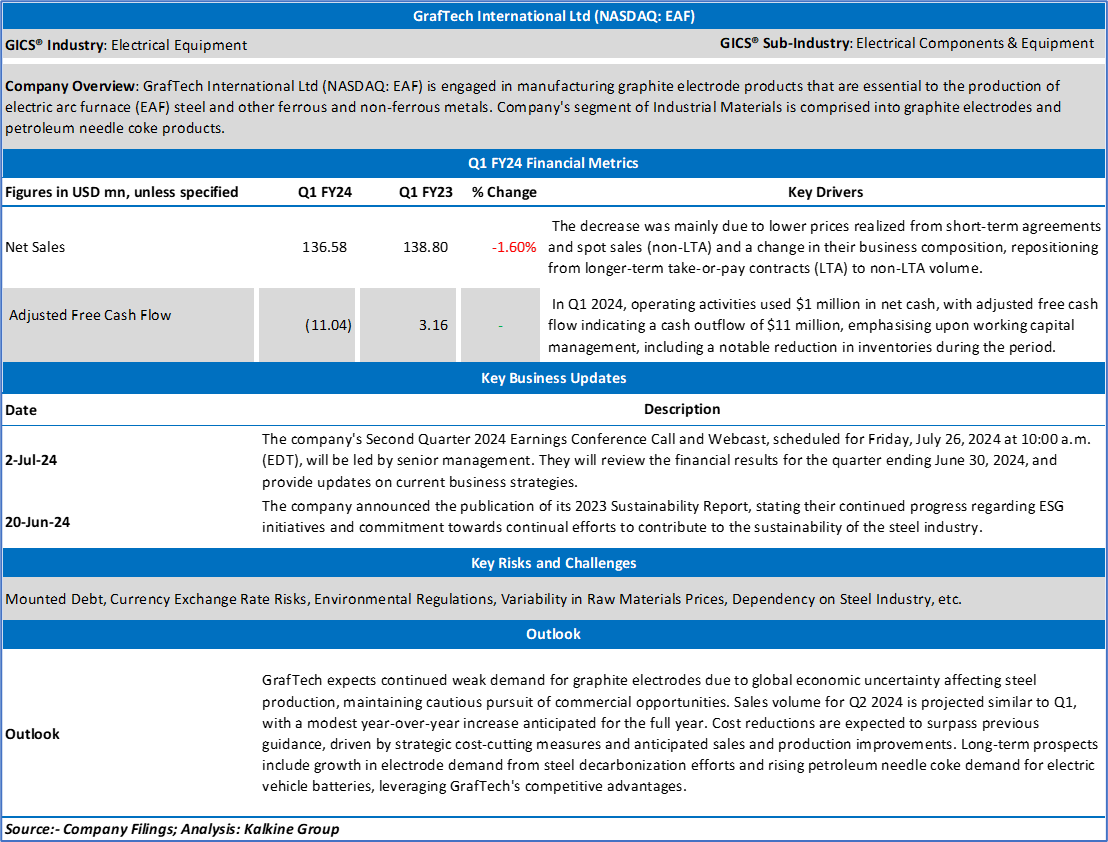
GrafTech International Ltd (NASDAQ: EAF) is engaged in manufacturing graphite electrode products that are essential to the production of electric arc furnace (EAF) steel and other ferrous and non-ferrous metals. Company's segment of Industrial Materials is comprised into graphite electrodes and petroleum needle coke products. This Report covers the Key Financial Metrics, Risks, and Technical Analysis along with the Valuation, Target Price, and Recommendation on the stock.
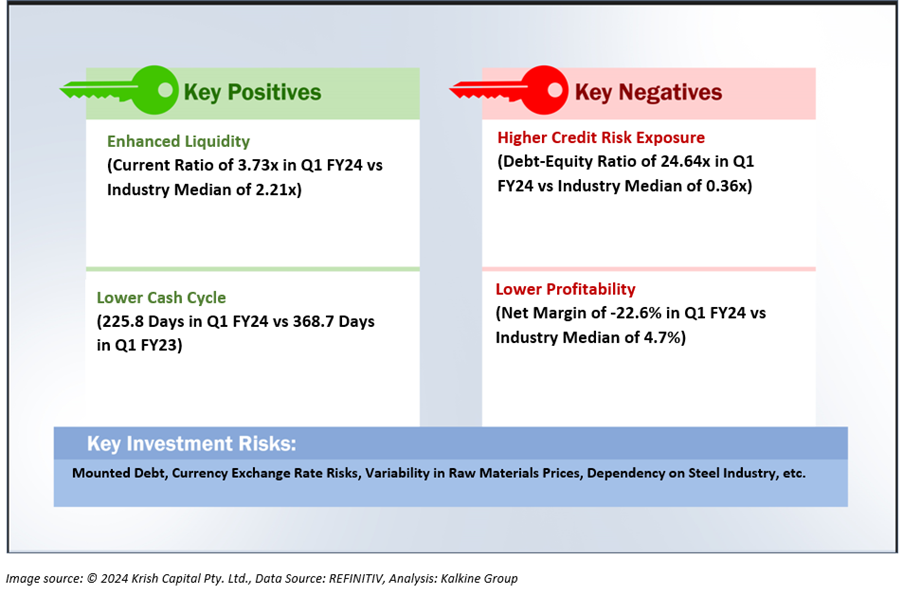
Section 1.0: Key Metrics in Pictures
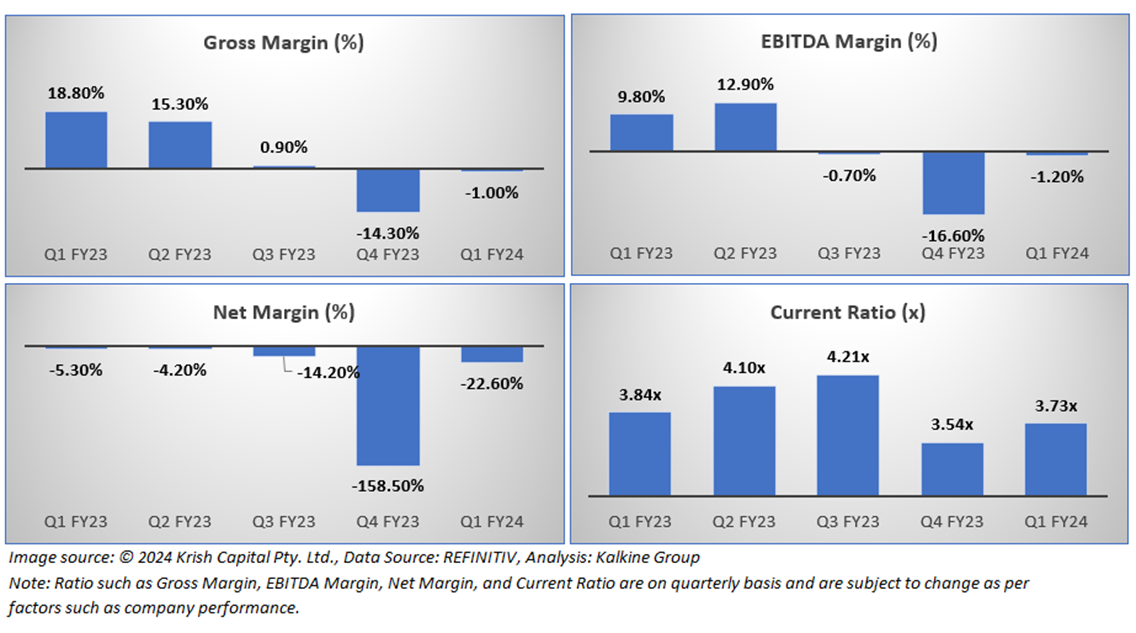
Having looked at the key financial metrics above, the below sections provide an in-depth fundamental and technical analysis on a Electrical Equipment Stock along with recommendations, technical support and resistance levels and indicative stop-loss.
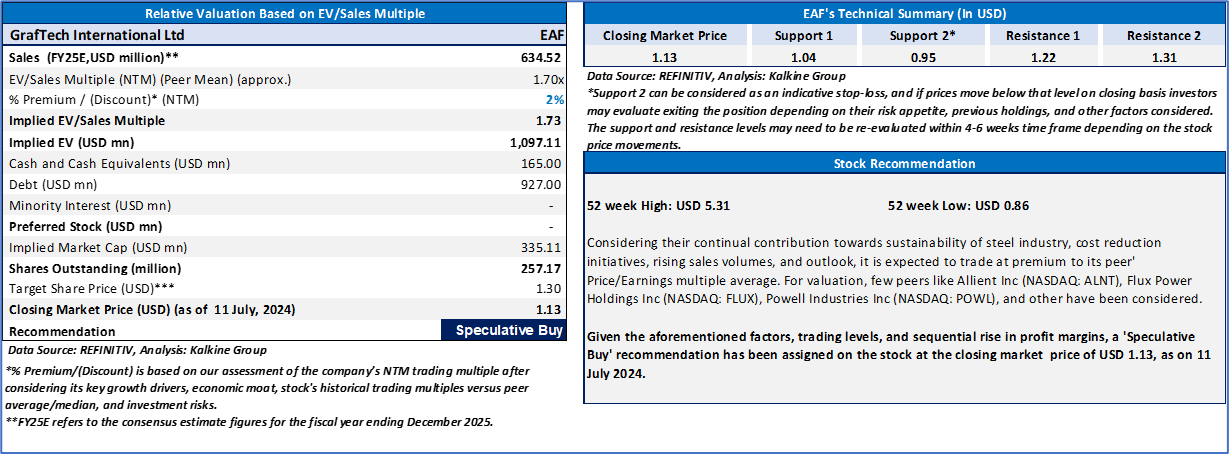
Section 2.0: GrafTech International Ltd (NASDAQ: EAF) (Speculative Buy at USD 1.13, closing market price as of 11 July 2024)
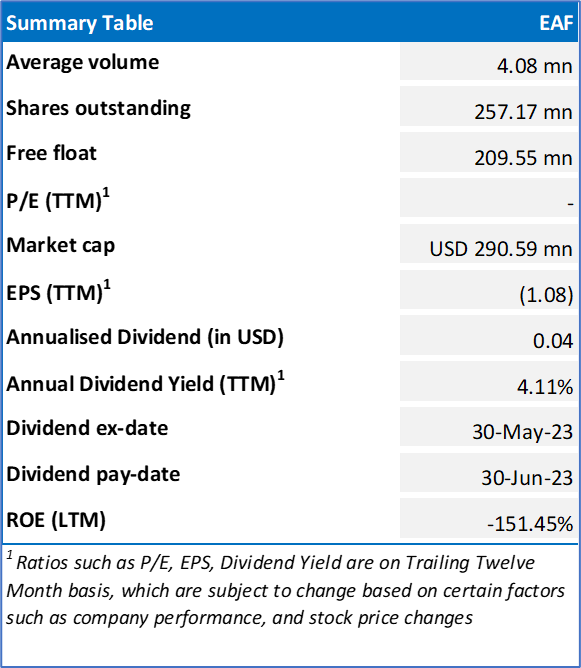
2.1 Company Details
2.2 Valuation and Technical Guidance
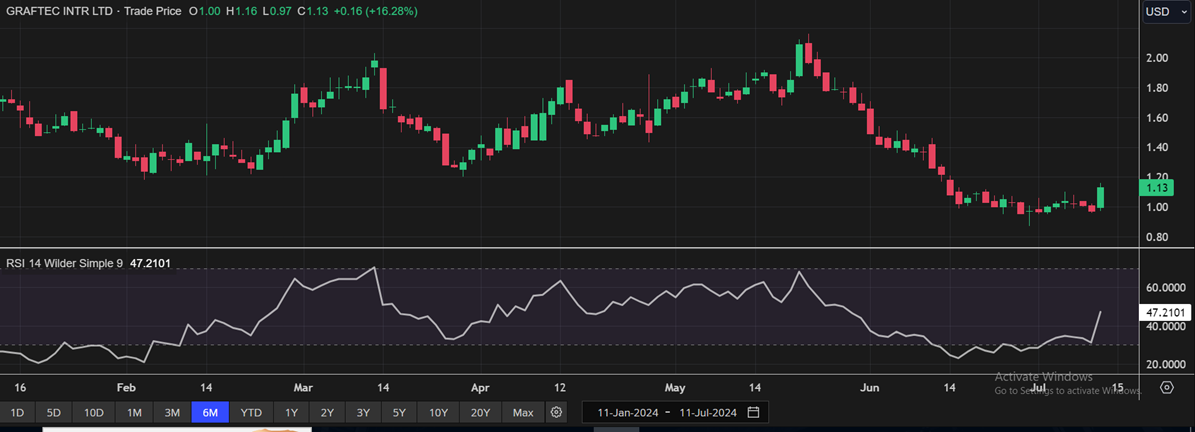
EAF’s Daily Chart; Analysis: REFINITIV
Technical Commentary
EAF's daily chart suggests a potential uptrend with a bullish reversal pattern near range-bound support. The 14-period RSI at 47.21 has rebounded from oversold levels, indicating strong bullish momentum. Key support levels lie below the 50-period SMA at 1.04 and 0.95, while resistance levels are at 1.22 and 1.31.
GrafTech International Ltd (NASDAQ: EAF) is a part of Global Fully Charged Portfolio
Please note markets are trading in a highly volatile zone currently due to certain macro-economic and geopolitical tensions prevailing. Therefore, it is prudent to follow a cautious approach while investing.
Note 1: Past performance is not a reliable indicator of future performance.
Note 2: The reference date for all price data, currency, technical indicators, support, and resistance level is 11 July 2024. The reference data in this report has been partly sourced from REFINITIV.
Note 3: Investment decisions should be made depending on an individual's appetite for upside potential, risks, holding duration, and any previous holdings. An 'Exit' from the stock can be considered if the Target Price mentioned as per the Valuation and or the technical levels provided has been achieved and is subject to the factors discussed above.
Note 4: Target Price refers to a price level which the stock is expected to reach as per the relative valuation method and/ or technical analysis taking into consideration both short-term and long-term scenarios.
Note 5: Dividend Yield may vary as per the stock price movement.
Technical Indicators Defined: -
Support: A level at which the stock prices tend to find support if they are falling, and a downtrend may take a pause backed by demand or buying interest. Support 1 refers to the nearby support level for the stock and if the price breaches the level, then Support 2 may act as the crucial support level for the stock.
Resistance: A level at which the stock prices tend to find resistance when they are rising, and an uptrend may take a pause due to profit booking or selling interest. Resistance 1 refers to the nearby resistance level for the stock and if the price surpasses the level, then Resistance 2 may act as the crucial resistance level for the stock.
Stop-loss: It is a level to protect further losses in case of unfavourable movement in the stock prices.
Kalkine Equities LLC, with Delaware File Number 4697384, Foreign Qualification Registration in California File Number 202109211078, and Texas File Number 805521396, is authorized to provide general advice only. The information on https://kalkine.com/ does not take into account any of your investment objectives, financial situation or needs. You should consider the appropriateness of advice taking into account your own objectives, financial situation and needs and seek independent financial advice before making any financial decisions. The link to our Terms and Conditions and Privacy Policy has been provided for your reference. On the date of publishing the reports (mentioned on the website), employees and/or associates of Kalkine do not hold positions in any of the stocks covered on the website. These stocks can change any time and readers of the reports should not consider these stocks as advice or recommendations later.
Copyright © 2024 Krish Capital Pty Ltd. All rights reserved.
Past performance is not a reliable indicator of future performance.
 Please wait processing your request...