MSFT 417.14 0.9731% AAPL 229.0 -0.3438% NVDA 119.37 1.5137% GOOGL 163.38 0.989% GOOG 165.11 1.0465% AMZN 178.5 3.7067% META 521.31 0.5963% AVGO 162.82 3.7533% TSLA 214.11 3.7958% TSM 171.7 1.5075% LLY 960.02 2.1081% V 276.37 0.7473% JPM 224.8 1.1656% UNH 590.2 -0.2316% NVO 139.16 1.1926% WMT 77.23 1.0599% LVMUY 149.005 -0.3844% XOM 117.94 -0.1608% LVMHF 745.0 -0.4011% MA 483.34 0.5283%
_10_16_2023_15_59_21_684955.jpg)
Section 1: Company Fundamentals
1.1 Company Overview and Performance summary
Company Overview:
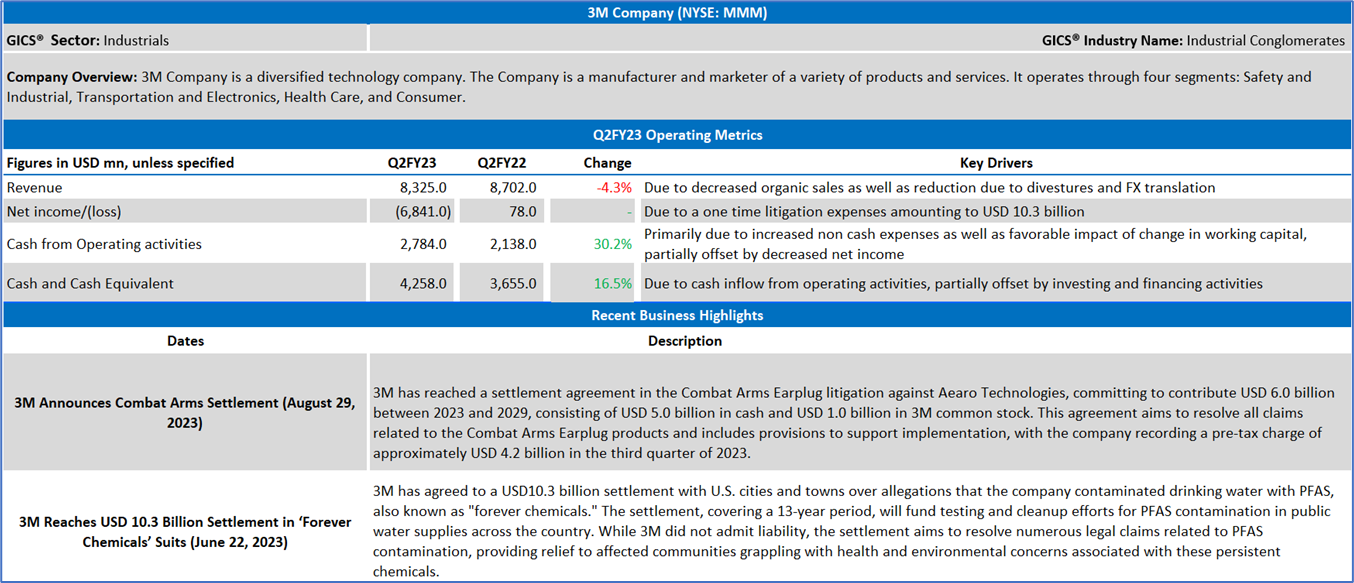
3M Company (NYSE: MMM) is a diversified technology company. The Company is a manufacturer and marketer of a variety of products and services. It operates through four segments: Safety and Industrial, Transportation and Electronics, Health Care, and Consumer.
This US Daily Report covers the Company Overview & Price performance, Summary table, Key positives & negatives, Key metrics, Company details, technical guidance & Stock recommendation, and Price chart.
Price Performance:
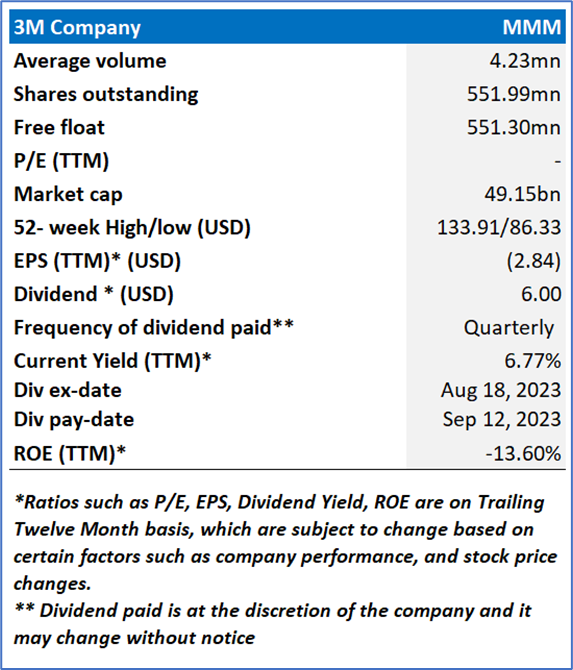
1.2 Summary Table
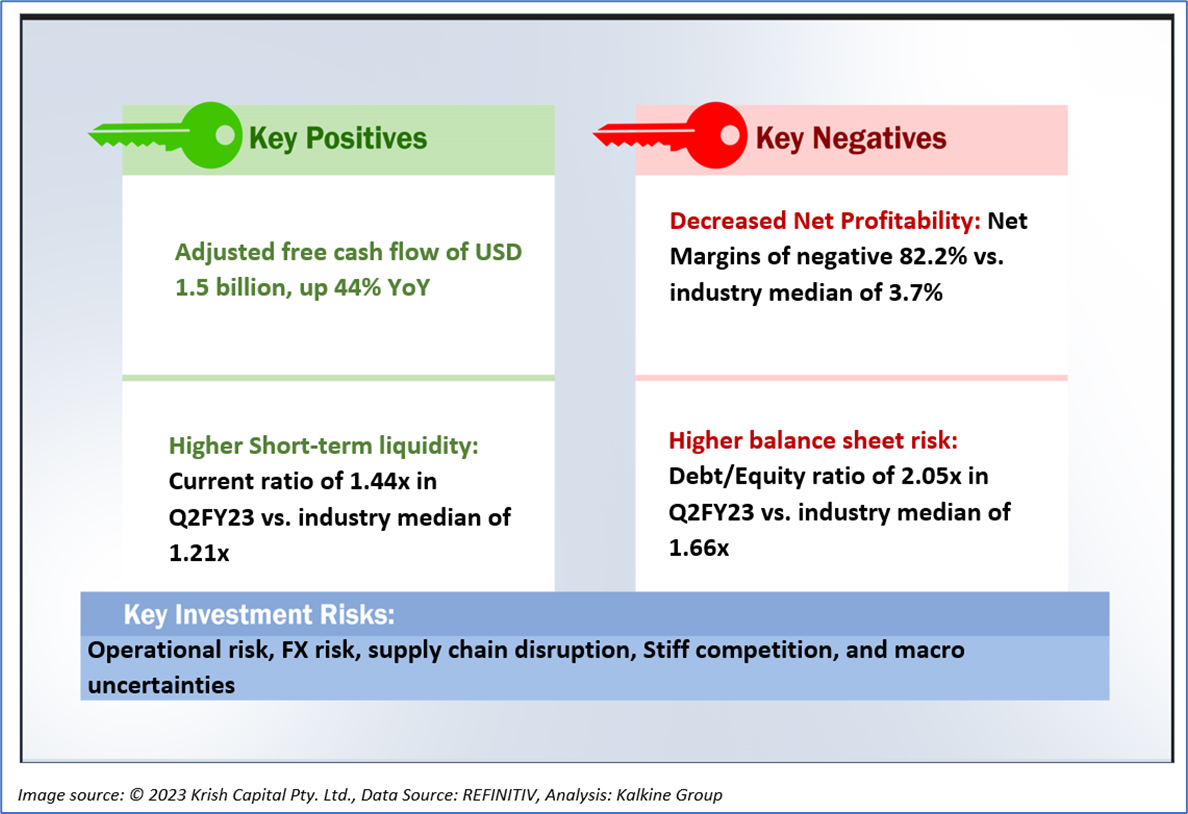
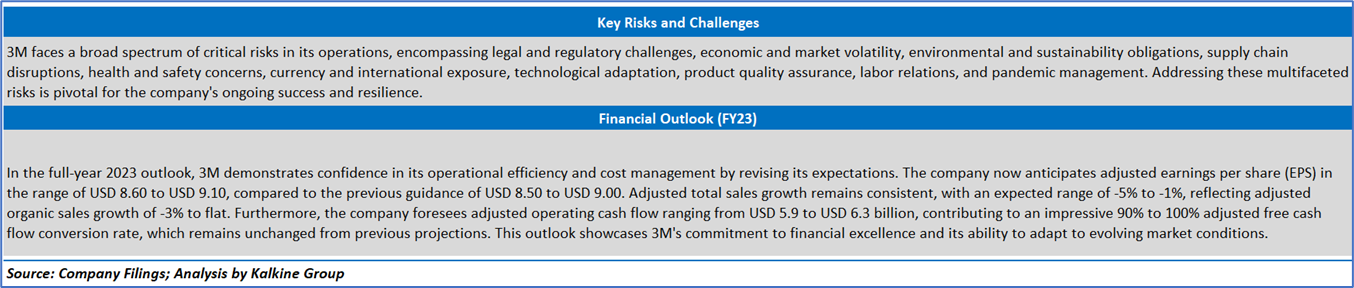
1.3 The Key Positives & Negatives
1.4 Key Metrics
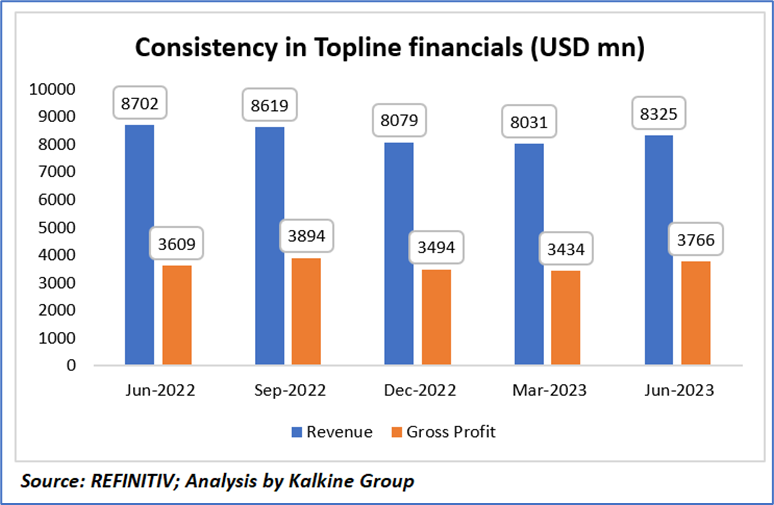
3M has showcased remarkable resilience and adaptability in its recent financial performance, which highlights its strength and promising future. Despite some fluctuations, the company's revenue reached USD 8,325 million in June 2023. More impressively, the gross profit surged to USD 3,766 million, indicating 3M's adept management of its operations.
These numbers reflect a company that can withstand market dynamics and navigate through challenges. 3M's ability to rebound from a temporary dip in revenue is a testament to its financial stability and growth potential. It's evident that the company is actively steering its operations towards sustained profitability and a bright future.
Section 2: 3M Company (“Buy” at the current market price of USD 88.97, as of October 16, 2023, at 07:05 am PDT)
2.1 Company Details
2.2 Technical Guidance and Stock Recommendation


Markets are trading in a highly volatile zone currently due to certain macroeconomic issues and geopolitical tensions prevailing. Therefore, it is prudent to follow a cautious approach while investing.
Note 1: Past performance is not a reliable indicator of future performance.
Note 2: The reference date for all price data, currency, technical indicators, support, and resistance levels is October 16, 2023. The reference data in this report has been partly sourced from REFINITIV.
Note 3: Investment decisions should be made depending on an individual's appetite for upside potential, risks, holding duration, and any previous holdings. An 'Exit' from the stock can be considered if the Target Price mentioned as per the Valuation and or the technical levels provided has been achieved and is subject to the factors discussed above.
Note 4: The report publishing date is as per the Pacific Time Zone.
Technical Indicators Defined: -
Support: A level at which the stock prices tend to find support if they are falling, and a downtrend may take a pause backed by demand or buying interest. Support 1 refers to the nearby support level for the stock and if the price breaches the level, then Support 2 may act as the crucial support level for the stock.
Resistance: A level at which the stock prices tend to find resistance when they are rising, and an uptrend may take a pause due to profit booking or selling interest. Resistance 1 refers to the nearby resistance level for the stock and if the price surpasses the level, then Resistance 2 may act as the crucial resistance level for the stock.
Stop-loss: It is a level to protect against further losses in case of unfavorable movement in the stock prices.
Kalkine Equities LLC provides general information about companies and their securities. The information contained in the reports, including any recommendations regarding the value of or transactions in any securities, does not take into account any of your investment objectives, financial situation or needs. Kalkine Equities LLC is not registered as an investment adviser in the U.S. with either the federal or state government. Before you make a decision about whether to invest in any securities, you should take into account your own objectives, financial situation and needs and seek independent financial advice. All information in our reports represents our views as at the date of publication and may change without notice.
Kalkine Media LLC, an affiliate of Kalkine Equities LLC, may have received, or be entitled to receive, financial consideration in connection with providing information about certain entity(s) covered on its website.
 US
US  AU
AU UK
UK CA
CA NZ
NZ Please wait processing your request...