
Daqo New Energy Corporation
Daqo New Energy Corp. (NYSE: DQ) is a polysilicon manufacturer. The Company utilizes the chemical vapor deposition process, or the modified Siemens process, to produce polysilicon. The Company's segments include Polysilicon and Wafer. The Company manufactures and sells polysilicon to photovoltaic product manufacturers, whereby the polysilicon is processed into ingots, wafers, cells, and modules for solar power solutions.

Recent Financial and Business Updates:
Production and Sales Growth: In Q3 2023, Daqo New Energy Corp. experienced significant expansion in polysilicon production, with volumes increasing to 57,664 MT, a notable rise from the previous quarter's 45,306 MT. Polysilicon sales also surged, reaching 63,263 MT in Q3 2023 compared to 51,550 MT in Q2 2023, indicating growth trends.
Cost Efficiency and Financial Challenges: The company achieved cost efficiency during this period, as evidenced by a decrease in the average total production cost to USD 6.52/kg in Q3 2023 from USD 6.92/kg in Q2 2023. However, despite operational improvements, financial results portrayed a challenging scenario. Revenue declined to USD 484.8 million in Q3 2023, with gross profit decreasing to USD 67.8 million, resulting in a gross margin of 14.0%, a significant drop from Q2 2023.
Adjusted Metrics and Earnings Decline: Adjusted financial metrics presented a mixed scenario, reflecting a decrease in adjusted net income to USD 44.0 million in Q3 2023 from USD 134.5 million in Q2 2023. Similarly, adjusted earnings per basic ADS declined to USD 0.59 in Q3 2023 from USD 1.75 in the previous quarter. EBITDA for Q3 2023 was USD 70.2 million, with an EBITDA margin of 14.5%, down from USD 230.0 million and a 36.1% margin in Q2 2023.
Operational Insights and Market Confidence: Mr. Xiang Xu, Chairman and CEO, provided insights into operational optimization efforts that led to increased production volume and decreased production costs. Despite a Q3 loss, the company generated USD 70 million in EBITDA, maintaining a strong balance sheet with USD 3.3 billion in cash. Xu expressed confidence in navigating market volatility.
Outlook and Financial Condition: Looking ahead, the company anticipates producing 59,000 to 62,000 MT of polysilicon in Q4 2023 and aims for a full-year production of 196,000 to 199,000 MT in 2023. The financial condition as of September 30, 2023, showcased USD 3,280.8 million in cash and restricted cash. Net cash provided by operating activities for the first nine months of 2023 was USD 1,497.4 million. Cash flows analysis revealed net cash used in investing activities of USD 954.3 million and net cash used in financing activities of USD 602.0 million for the same period. In summary, this update highlights Daqo New Energy Corp.'s performance, industry dynamics, and strategic positioning.
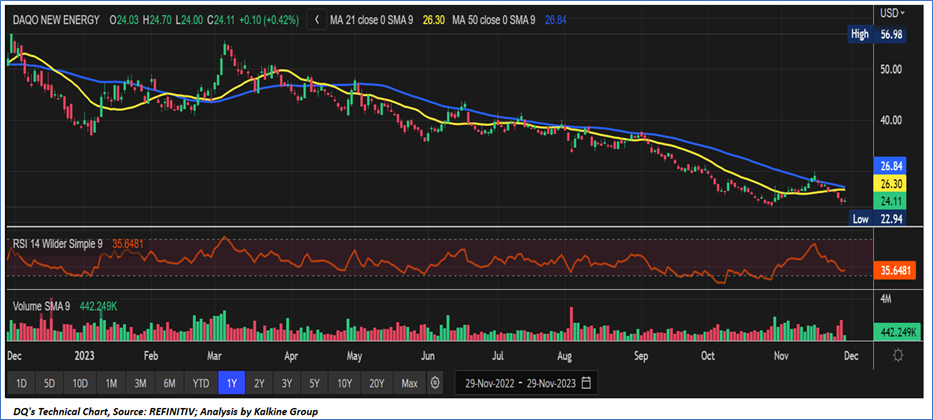
Technical Observation (on the daily chart)
The Relative Strength Index (RSI), calculated over a 14-day span, stands at 35.65, currently moving towards overbought zone, signifying the likelihood of either more consolidation or a brief surge soon. Adding to this, the stock presently finds itself positioned below both the 21-day and 50-day Simple Moving Averages (SMA), which could function as a dynamic short-term resistance levels. Now, the stock's price hovers around a crucial support range of USD 22.00 to USD 24.00, with an anticipation of an impending upward shift originating in case of a support from these support levels as the price is also showing expectations of a double bottom on the daily time frame.

As per the above-mentioned price action, recent key business and financial updates, momentum in the stock over the last month, and technical indicators analysis, a ‘Buy’ rating has been given to Daqo New Energy Corp. (NYSE: DQ) at the current market price of USD 24.11, as of November 29, 2023, at 07:20 am PST.
Markets are trading in a highly volatile zone currently due to certain macro-economic issues and prevailing geopolitical tensions. Therefore, it is prudent to follow a cautious approach while investing.
Related Risk: This report may be looked at from a high-risk perspective and a recommendation is provided for a short duration. This report is solely based on technical parameters, and the fundamental performance of the stocks has not been considered in the decision-making process. Other factors which could impact the stock prices include market risks, regulatory risks, interest rates risks, currency risks, social and political instability risks etc.
How to Read the Charts?
The yellow colour line reflects the 21-period simple moving average (SMA) while the blue line indicates the 50- period simple moving average (SMA). SMA helps to identify existing price trends. If the prices are trading above the 21-period and 50-period moving average, then it shows prices are currently trading in a bullish trend.
The orange colour line in the chart’s lower segment reflects the Relative Strength Index (14-Period) which indicates price momentum and signals momentum in trend. A reading of 70 or above suggests overbought status while a reading of 30 or below suggests an oversold status.
The red and green colour bars in the chart’s lower segment show the volume of the stock. The volume is the number of shares that changed hands during a given day. Stocks with high volumes are more liquid than stocks with lesser volume as liquidity in stocks helps with easier and faster execution of the order.
The Orange colour lines are the trend lines drawn by connecting two or more price points and used for trend identification purposes. The trend line also acts as a line of support and resistance.
Technical Indicators Defined: -
Support: A level at which the stock prices tend to find support if they are falling, and a downtrend may take a pause backed by demand or buying interest. Support 1 refers to the nearby support level for the stock and if the price breaches the level, then Support 2 may act as the crucial support level for the stock.
Resistance: A level at which the stock prices tend to find resistance when they are rising, and an uptrend may take a pause due to profit booking or selling interest. Resistance 1 refers to the nearby resistance level for the stock and if the price surpasses the level, then Resistance 2 may act as the crucial resistance level for the stock.
Stop-loss: It is a level to protect further losses in case of unfavourable movement in the stock prices.
The reference date for all price data, currency, technical indicators, support, and resistance levels is November 29, 2023. The reference data in this report has been partly sourced from REFINITIV.
Abbreviations
CMP: Current Market Price
SMA: Simple Moving Average
RSI: Relative Strength Index
USD: United States dollar
Note: Trading decisions require a thorough analysis by individual. Technical reports in general chart out metrics that may be assessed by individuals before any stock evaluation. The above are illustrative analytical factors used for evaluating the stocks; other parameters can be looked at along with additional risks per se. Past performance is neither an indicator nor a guarantee of future performance.
Kalkine Equities LLC provides general information about companies and their securities. The information contained in the reports, including any recommendations regarding the value of or transactions in any securities, does not take into account any of your investment objectives, financial situation or needs. Kalkine Equities LLC is not registered as an investment adviser in the U.S. with either the federal or state government. Before you make a decision about whether to invest in any securities, you should take into account your own objectives, financial situation and needs and seek independent financial advice. All information in our reports represents our views as at the date of publication and may change without notice.
Kalkine Media LLC, an affiliate of Kalkine Equities LLC, may have received, or be entitled to receive, financial consideration in connection with providing information about certain entity(s) covered on its website.
Past performance is not a reliable indicator of future performance.
 Please wait processing your request...