
Kinnate Biopharma Inc.
Kinnate Biopharma Inc. (NASDAQ: KNTE) is a clinical-stage precision oncology company. It is focused on the discovery, design, and development of small molecule kinase inhibitors for difficult-to-treat, genomically defined cancers. Its lead product candidate is exarafenib (KIN-2787), which is a Rapidly Accelerated Fibrosarcoma (RAF) inhibitor in development for the treatment of patients with lung cancer, melanoma, and other solid tumours.
Recent Financial and Business Updates:
Technical Observation (on the daily chart)
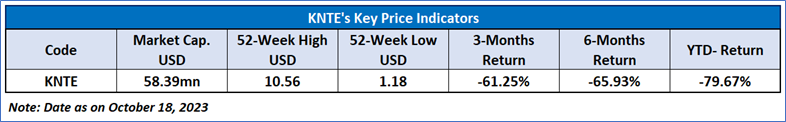
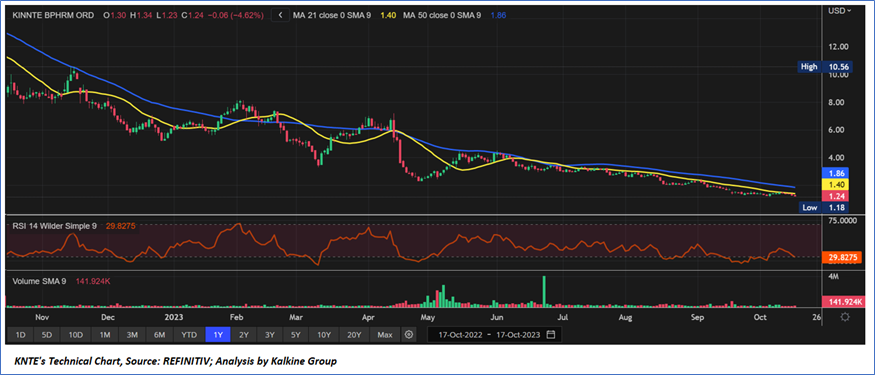
The stock hit its highest point in the past 52 weeks, reaching USD 10.56 on November 15, 2022, with price correcting by around 88.22%. The Relative Strength Index (RSI) observed over a 14-day period registers at 29.83, indicating oversold conditions. This suggests the potential for a short-term uptick in momentum or a period of consolidation. Furthermore, the stock's current position is situated below both the 21-day Simple Moving Average (SMA) and the 50-day SMA, potentially acting as dynamic short-term resistance levels. Currently, the stock price appears to be forming a double bottom pattern within the range of USD 1.00 to USD 1.20, with expectations of a notable upward surge once it breaches the USD 1.50 levels on the upside.
Markets are trading in a highly volatile zone currently due to certain macro-economic issues and prevailing geopolitical tensions. Therefore, it is prudent to follow a cautious approach while investing.
Related Risk: This report may be looked at from a high-risk perspective and a recommendation is provided for a short duration. This report is solely based on technical parameters, and the fundamental performance of the stocks has not been considered in the decision-making process. Other factors which could impact the stock prices include market risks, regulatory risks, interest rates risks, currency risks, social and political instability risks etc.
How to Read the Charts?
The yellow colour line reflects the 21-period simple moving average (SMA) while the blue line indicates the 50- period simple moving average (SMA). SMA helps to identify existing price trends. If the prices are trading above the 21-period and 50-period moving average, then it shows prices are currently trading in a bullish trend.
The orange colour line in the chart’s lower segment reflects the Relative Strength Index (14-Period) which indicates price momentum and signals momentum in trend. A reading of 70 or above suggests overbought status while a reading of 30 or below suggests an oversold status.
The red and green colour bars in the chart’s lower segment show the volume of the stock. The volume is the number of shares that changed hands during a given day. Stocks with high volumes are more liquid than stocks with lesser volume as liquidity in stocks helps with easier and faster execution of the order.
The Orange colour lines are the trend lines drawn by connecting two or more price points and used for trend identification purposes. The trend line also acts as a line of support and resistance.
Technical Indicators Defined: -
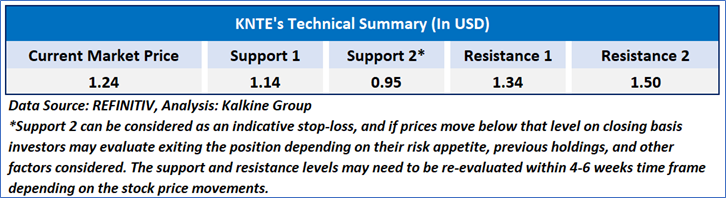
Support: A level at which the stock prices tend to find support if they are falling, and a downtrend may take a pause backed by demand or buying interest. Support 1 refers to the nearby support level for the stock and if the price breaches the level, then Support 2 may act as the crucial support level for the stock.
Resistance: A level at which the stock prices tend to find resistance when they are rising, and an uptrend may take a pause due to profit booking or selling interest. Resistance 1 refers to the nearby resistance level for the stock and if the price surpasses the level, then Resistance 2 may act as the crucial resistance level for the stock.
Stop-loss: It is a level to protect further losses in case of unfavourable movement in the stock prices.
The reference date for all price data, currency, technical indicators, support, and resistance levels is October 17, 2023. The reference data in this report has been partly sourced from REFINITIV.
Abbreviations
CMP: Current Market Price
SMA: Simple Moving Average
RSI: Relative Strength Index
USD: United States dollar
Note: Trading decisions require a thorough analysis by individual. Technical reports in general chart out metrics that may be assessed by individuals before any stock evaluation. The above are illustrative analytical factors used for evaluating the stocks; other parameters can be looked at along with additional risks per se. Past performance is neither an indicator nor a guarantee of future performance.
Past performance is not a reliable indicator of future performance.
 Please wait processing your request...