
FinVolution Group
FinVolution Group (NYSE: FINV), formerly PPDAI GROUP INC, is a China-based company mainly engaged in operating an online consumer finance platform. The Company’s products and services include loan services offered to borrowers, investment services offered to individual investors and institutional funding partners.
Recent Financial and Business Updates:
Operational Overview in the Chinese Market: The third quarter of 2023 witnessed noteworthy metrics in the Chinese market. Cumulative registered users reached 152.6 million as of September 30, 2023, marking an 8.3% increase from the same period in 2022. Cumulative borrowers in China reached 24.8 million, indicating a 6.9% increase. However, unique borrowers for Q3 2023 saw an 8.0% decrease compared to the corresponding period in 2022. The transaction volume for Q3 2023 reached RMB49.1 billion, reflecting a substantial 10.6% increase. Additionally, the outstanding loan balance as of September 30, 2023, rose to RMB64.6 billion, depicting an 8.4% increase from September 30, 2022. Other key metrics include average loan size, average loan tenure, and the 90-day+ delinquency ratio.
Expansion into the International Market: Turning attention to the international market, cumulative registered users experienced a significant surge of 69.2%, reaching 22.5 million as of September 30, 2023, in comparison to the same period in 2022. Cumulative borrowers for the international market saw substantial growth, reaching 4.4 million, a notable 41.9% increase. Both the number of unique borrowers and new borrowers for Q3 2023 exhibited positive trends, increasing by 27.4% and 27.3%, respectively. The transaction volume for the international market in the third quarter of 2023 reached RMB2.21 billion, indicating a remarkable 99.1% increase from the same period in 2022. The outstanding loan balance increased to RMB1.29 billion, marking a 101.6% rise. International business revenue for Q3 2023 was RMB584.8 million (USD 80.2 million), representing 18.3% of the total revenue for the same period.
Financial Highlights for Q3 2023: In terms of financial performance during the third quarter of 2023, net revenue demonstrated a 7.6% increase to RMB3,197.5 million (USD 438.3 million) compared to the same period in 2022. Despite this, net profit experienced a 5.1% decrease, totaling RMB574.7 million (USD 78.8 million). The non-GAAP adjusted operating income decreased by 14.5% to RMB583.8 million (USD 80.0 million). Diluted net profit per ADS and per share remained unchanged, while non-GAAP diluted net profit per ADS and per share increased by 1.4%. As of September 30, 2023, the company's financial position includes cash and cash equivalents of RMB5,700.7 million (USD 781.3 million) and short-term investments of RMB2,824.5 million (USD 387.1 million), primarily in wealth management products and term deposits.
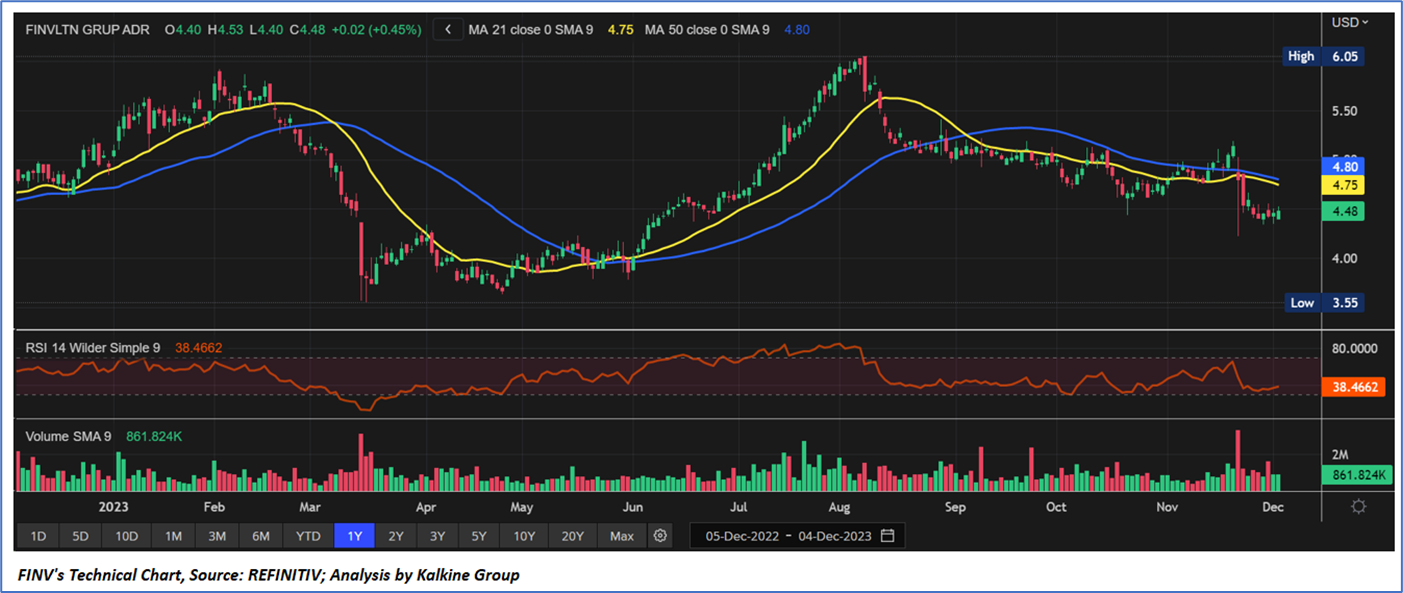
Technical Observation (on the daily chart)
Presently, the stock has corrected by approximately 7.63% in the past month, due to a correction after the quarterly results announcement. The Relative Strength Index (RSI) over a 14-day period stands at 38.46, currently near oversold zone, with expectations of some consolidation or an upward momentum. Moreover, the price is currently positioned below both the 21-day SMA and 50-day SMA trend-following indicators, which may act as dynamic short-term resistance levels.
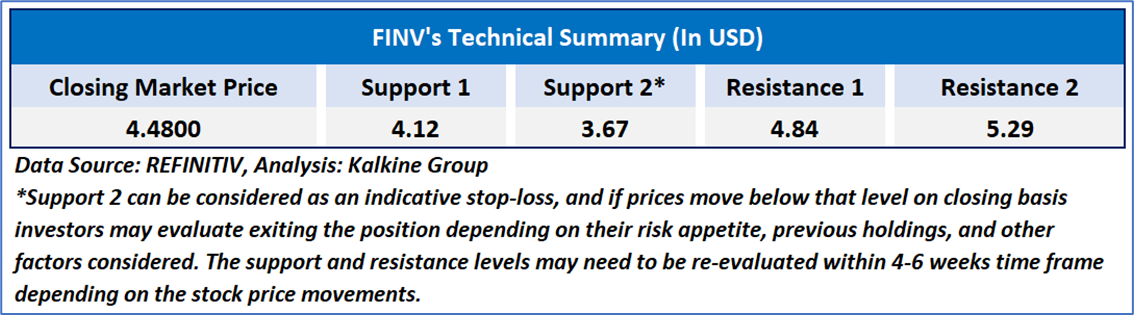
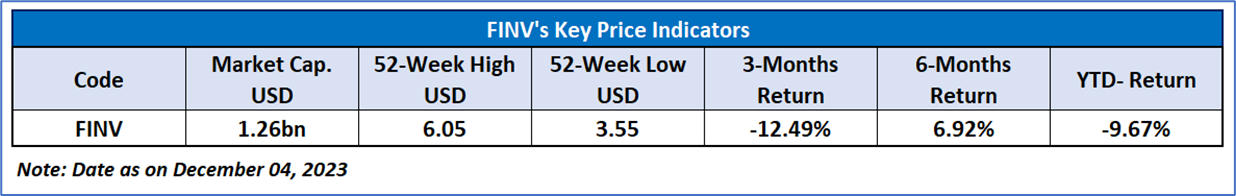
As per the above-mentioned price action, recent key business and financial updates, momentum in the stock over the last month, and technical indicators analysis, a “BUY” rating is recommended for FinVolution Group (NYSE: FINV) at its closing market price of USD 4.48 as on December 04, 2023.
Individuals can evaluate the stock based on the support and resistance levels provided in the report in case of keen interest taking into consideration the risk-reward scenario.
Markets are trading in a highly volatile zone currently due to certain macro-economic issues and prevailing geopolitical tensions. Therefore, it is prudent to follow a cautious approach while investing.
Related Risk: This report may be looked at from a high-risk perspective and a recommendation is provided for a short duration. This report is solely based on technical parameters, and the fundamental performance of the stocks has not been considered in the decision-making process. Other factors which could impact the stock prices include market risks, regulatory risks, interest rates risks, currency risks, social and political instability risks etc.
How to Read the Charts?
The yellow colour line reflects the 21-period simple moving average (SMA) while the blue line indicates the 50- period simple moving average (SMA). SMA helps to identify existing price trends. If the prices are trading above the 21-period and 50-period moving average, then it shows prices are currently trading in a bullish trend.
The orange colour line in the chart’s lower segment reflects the Relative Strength Index (14-Period) which indicates price momentum and signals momentum in trend. A reading of 70 or above suggests overbought status while a reading of 30 or below suggests an oversold status.
The red and green colour bars in the chart’s lower segment show the volume of the stock. The volume is the number of shares that changed hands during a given day. Stocks with high volumes are more liquid than stocks with lesser volume as liquidity in stocks helps with easier and faster execution of the order.
The Orange colour lines are the trend lines drawn by connecting two or more price points and used for trend identification purposes. The trend line also acts as a line of support and resistance.
Technical Indicators Defined: -
Support: A level at which the stock prices tend to find support if they are falling, and a downtrend may take a pause backed by demand or buying interest. Support 1 refers to the nearby support level for the stock and if the price breaches the level, then Support 2 may act as the crucial support level for the stock.
Resistance: A level at which the stock prices tend to find resistance when they are rising, and an uptrend may take a pause due to profit booking or selling interest. Resistance 1 refers to the nearby resistance level for the stock and if the price surpasses the level, then Resistance 2 may act as the crucial resistance level for the stock.
Stop-loss: It is a level to protect further losses in case of unfavourable movement in the stock prices.
The reference date for all price data, currency, technical indicators, support, and resistance levels is December 04, 2023. The reference data in this report has been partly sourced from REFINITIV.
Abbreviations
CMP: Current Market Price
SMA: Simple Moving Average
RSI: Relative Strength Index
USD: United States dollar
Note: Trading decisions require a thorough analysis by individual. Technical reports in general chart out metrics that may be assessed by individuals before any stock evaluation. The above are illustrative analytical factors used for evaluating the stocks; other parameters can be looked at along with additional risks per se. Past performance is neither an indicator nor a guarantee of future performance.
Kalkine Equities LLC provides general information about companies and their securities. The information contained in the reports, including any recommendations regarding the value of or transactions in any securities, does not take into account any of your investment objectives, financial situation or needs. Kalkine Equities LLC is not registered as an investment adviser in the U.S. with either the federal or state government. Before you make a decision about whether to invest in any securities, you should take into account your own objectives, financial situation and needs and seek independent financial advice. All information in our reports represents our views as at the date of publication and may change without notice.
Kalkine Media LLC, an affiliate of Kalkine Equities LLC, may have received, or be entitled to receive, financial consideration in connection with providing information about certain entity(s) covered on its website.
Past performance is not a reliable indicator of future performance.
 Please wait processing your request...