
Magic Software Enterprises Ltd
Magic Software Enterprises Ltd. (NASDAQ: MGIC) is a provider of application development, business process integration platforms, vertical software solutions and related professional services. The Company is a vendor of information technology (IT) outsourcing services. Its software technology is used by customers to develop, deploy, and integrate on-premises, mobile and cloud-based business. It operates in two segments: software solutions and IT professional services.
Recent Financial and Business Updates:
Financial Performance in Q3 2023: In the third quarter of 2023, Magic Software experienced a 10.1% decline in revenues, totaling USD 129.5 million, compared to USD 144.0 million in the same period last year. On a constant currency basis, adjusting for exchange rates, the revenue decrease would have been 6.0%, amounting to USD 135.3 million. This decline was driven by an unforeseen drop in demand from key U.S.-based clients, resulting in a negative impact of approximately USD 16 million on Q3 2023 revenues.
Operating Income and Non-GAAP Performance: Operating income for Q3 2023 decreased by 19.2% to USD 13.3 million, compared to USD 16.5 million in the previous year. On a constant currency basis, Q3 2023 operating income would have decreased by 15.0%, reaching USD 14.0 million. The operating income included USD 0.6 million related to the cost of share-based payments to employees. Non-GAAP operating income witnessed an 8.8% decrease, amounting to USD 17.2 million.
Net Income and Non-GAAP Net Income: Net income attributable to Magic Software’s shareholders for Q3 2023 decreased by 38.6% to USD 7.1 million, or USD 0.15 per fully diluted share, compared to USD 11.6 million, or USD 0.24 per fully diluted share, in the same period of the previous year. Non-GAAP net income for Q3 2023 decreased by 23.9% to USD 10.4 million, or USD 0.21 per fully diluted share, compared to USD 13.7 million, or USD 0.28 per fully diluted share, primarily due to a decrease in operating profit and an increase in interest expenses.
Q4 2023 Guidance: In a pre-announcement on November 8, 2023, Magic revised its Q4 2023 revenue guidance to a range of USD 115 million to USD 125 million. This conservative guidance considers external factors beyond control, such as currency headwinds, an unexpected decline in demand from major U.S.-based clients, and the impact of Israel’s war against the terrorist organization Hamas.
Summary Results for First Nine Months of 2023
GAAP Results: For the first nine months of 2023, GAAP revenues decreased by 2.4% to USD 409.5 million compared to USD 419.6 million in the same period last year. Gross profit increased by 2.2% to USD 116.0 million, with a gross margin of 28.3%. Operating income was USD 44.1 million, reflecting a 7.3% decrease, and net income attributable to Magic Software’s shareholders decreased by 7.6% to USD 28.5 million, or USD 0.58 per fully diluted share.
Non-GAAP Results: Non-GAAP revenues for the first nine months remained constant at USD 409.5 million. Gross profit increased by 1.9% to USD 119.8 million, with a gross margin of 29.3%. Non-GAAP operating income decreased by 3.0% to USD 54.1 million, with an operating margin of 13.2%. Non-GAAP net income attributable to Magic Software’s shareholders decreased by 4.1% to USD 36.8 million, or USD 0.75 per fully diluted share.
Cash Flow and Financial Position: Cash flow from operating activities for the first nine months of 2023 amounted to USD 65.5 million compared to USD 40.3 million in the same period last year. As of September 30, 2023, Magic’s cash and cash equivalents and short-term bank deposits totaled USD 107.0 million.
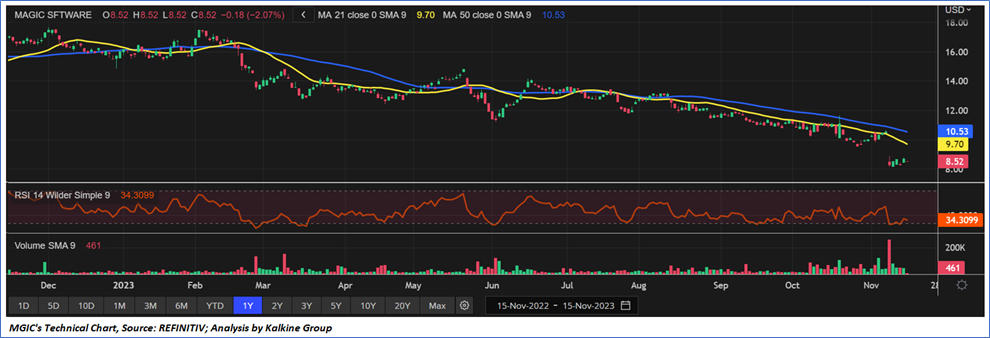
Technical Observation (on the daily chart)
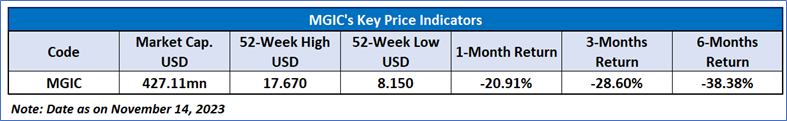
Presently, the stock has corrected by approximately 43.91% since reaching its highest point in the past 52 weeks, which occurred on June 20, 2023. The Relative Strength Index (RSI) over a 14-day period stands at 43.54, upward trending and recovering from oversold zone, with expectations of an upside movement. Moreover, the price is currently positioned below both the 21-day SMA and 50-day SMA trend-following indicators, which may act as dynamic short-term resistance levels.
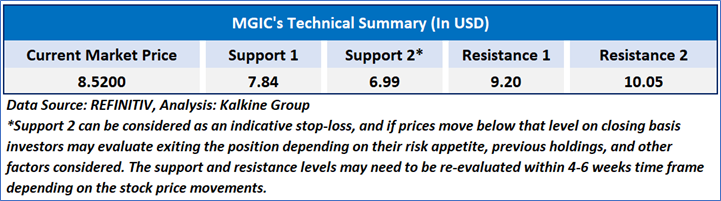
As per the above-mentioned price action, recent key business and financial updates, momentum in the stock over the last month, and technical indicators analysis, a “BUY” rating is recommended for Magic Software Enterprises Ltd. (NASDAQ: MGIC) at its current market price of USD 8.52 as on November 15, 2023, at 08:30 am PDT.
Individuals can evaluate the stock based on the support and resistance levels provided in the report in case of keen interest taking into consideration the risk-reward scenario.
Markets are trading in a highly volatile zone currently due to certain macro-economic issues and prevailing geopolitical tensions. Therefore, it is prudent to follow a cautious approach while investing.
Related Risk: This report may be looked at from a high-risk perspective and a recommendation is provided for a short duration. This report is solely based on technical parameters, and the fundamental performance of the stocks has not been considered in the decision-making process. Other factors which could impact the stock prices include market risks, regulatory risks, interest rates risks, currency risks, social and political instability risks etc.
How to Read the Charts?
The yellow colour line reflects the 21-period simple moving average (SMA) while the blue line indicates the 50- period simple moving average (SMA). SMA helps to identify existing price trends. If the prices are trading above the 21-period and 50-period moving average, then it shows prices are currently trading in a bullish trend.
The orange colour line in the chart’s lower segment reflects the Relative Strength Index (14-Period) which indicates price momentum and signals momentum in trend. A reading of 70 or above suggests overbought status while a reading of 30 or below suggests an oversold status.
The red and green colour bars in the chart’s lower segment show the volume of the stock. The volume is the number of shares that changed hands during a given day. Stocks with high volumes are more liquid than stocks with lesser volume as liquidity in stocks helps with easier and faster execution of the order.
The Orange colour lines are the trend lines drawn by connecting two or more price points and used for trend identification purposes. The trend line also acts as a line of support and resistance.
Technical Indicators Defined: -
Support: A level at which the stock prices tend to find support if they are falling, and a downtrend may take a pause backed by demand or buying interest. Support 1 refers to the nearby support level for the stock and if the price breaches the level, then Support 2 may act as the crucial support level for the stock.
Resistance: A level at which the stock prices tend to find resistance when they are rising, and an uptrend may take a pause due to profit booking or selling interest. Resistance 1 refers to the nearby resistance level for the stock and if the price surpasses the level, then Resistance 2 may act as the crucial resistance level for the stock.
Stop-loss: It is a level to protect further losses in case of unfavourable movement in the stock prices.
The reference date for all price data, currency, technical indicators, support, and resistance levels is November 15, 2023. The reference data in this report has been partly sourced from REFINITIV.
Abbreviations
CMP: Current Market Price
SMA: Simple Moving Average
RSI: Relative Strength Index
USD: United States dollar
Note: Trading decisions require a thorough analysis by individual. Technical reports in general chart out metrics that may be assessed by individuals before any stock evaluation. The above are illustrative analytical factors used for evaluating the stocks; other parameters can be looked at along with additional risks per se. Past performance is neither an indicator nor a guarantee of future performance.
Kalkine Equities LLC provides general information about companies and their securities. The information contained in the reports, including any recommendations regarding the value of or transactions in any securities, does not take into account any of your investment objectives, financial situation or needs. Kalkine Equities LLC is not registered as an investment adviser in the U.S. with either the federal or state government. Before you make a decision about whether to invest in any securities, you should take into account your own objectives, financial situation and needs and seek independent financial advice. All information in our reports represents our views as at the date of publication and may change without notice.
Kalkine Media LLC, an affiliate of Kalkine Equities LLC, may have received, or be entitled to receive, financial consideration in connection with providing information about certain entity(s) covered on its website.
Past performance is not a reliable indicator of future performance.
 Please wait processing your request...