Section 1: Company Fundamentals
1.1Company Overview and Performance summary
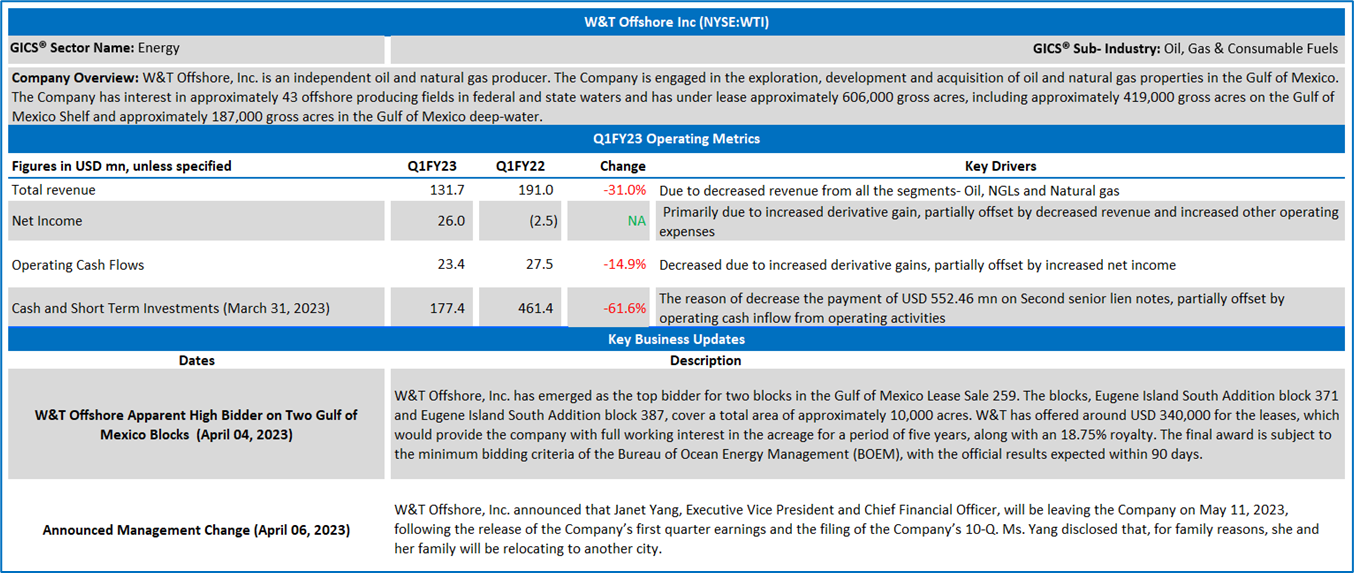
Company Overview:
W&T Offshore, Inc. (NYSE: WTI) is an independent oil and natural gas producer. The Company is engaged in the exploration, development and acquisition of oil and natural gas properties in the Gulf of Mexico. The Company has interest in approximately 43 offshore producing fields in federal and state waters and has under lease approximately 606,000 gross acres, including approximately 419,000 gross acres on the Gulf of Mexico Shelf and approximately 187,000 gross acres in the Gulf of Mexico deep-water.
This US Inflation Report covers the Company Overview & Price performance, Summary table, Key positives & negatives, Key metrics, Underlying commodities analysis, Company details, Technical guidance & Stock recommendation, and Price chart.
Price Performance:
1.2 Summary Table
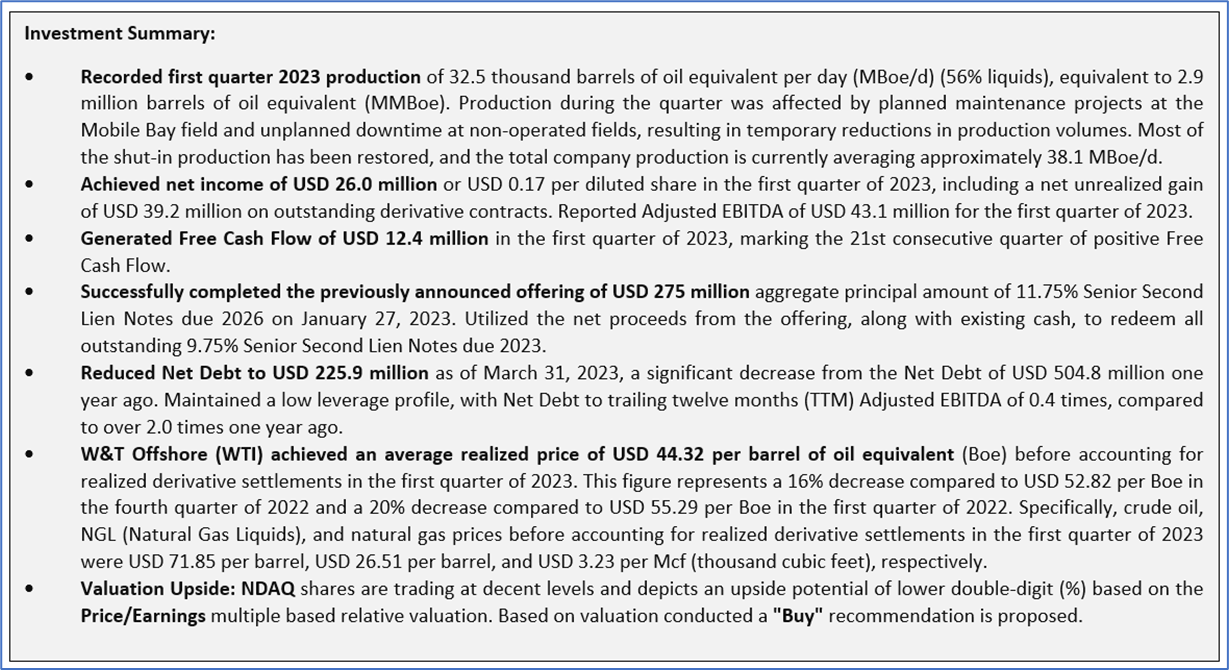
1.3 The Key Positives, Negatives & Investment Summary

1.4 Key Metrics
Even throughout periods of rising inflation across all major economies, the firm was able to keep costs under control and maintain revenue constancy, which allowed it to earn larger net profit margins on a YoY basis.

1.5 Underlying Commodity Analysis:
WTI crude futures remained above USD 70 per barrel, with a 4% increase in the previous session. This rise was supported by interest rate cuts in China and a pause in the US Federal Reserve's tightening campaign, boosting the demand outlook for the world's top two oil consumers. The International Energy Agency expects global oil demand to grow by 6% between 2022 and 2028, further bolstering the oil market. The weakening US dollar also played a role, as it makes oil more affordable for holders of other currencies and increases market risk appetite. However, concerns persist among investors due to uncertainties in the global economy, such as weak Chinese economic data and potential interest rate hikes by major central banks.
Meanwhile, US natural gas futures surpassed USD 2.45/MMBtu, reaching a three-week high. This surge was driven by a smaller-than-expected increase in gas stocks, coupled with rising demand and declining supply. US utilities added 84 billion cubic feet of gas to storage, falling short of the market's anticipated 95 bcf increase. Furthermore, an upcoming heatwave from June 23-30 is expected to boost gas demand, particularly for power generation in air conditioning. Although domestic gas output has declined from the record level seen in May, gas flow to US LNG export plants has decreased due to maintenance activities at various facilities, including Cheniere Energy Inc's Sabine Pass LNG in Louisiana.
Section 2: W&T Offshore Inc (“Buy” at closing market price of USD 4.07, as of June 15, 2023)
2.1 Company Details

2.2 Valuation and Technical Guidance


Markets are trading in a highly volatile zone currently due to certain macroeconomic issues and geopolitical tensions prevailing. Therefore, it is prudent to follow a cautious approach while investing.
Note 1: Past performance is not a reliable indicator of future performance.
Note 2: The reference date for all price data, currency, technical indicators, support, and resistance levels is June 15, 2023. The reference data in this report has been partly sourced from REFINITIV.
Note 3: Investment decisions should be made depending on an individual's appetite for upside potential, risks, holding duration, and any previous holdings. An 'Exit' from the stock can be considered if the Target Price mentioned as per the Valuation and or the technical levels provided has been achieved and is subject to the factors discussed above.
Note 4: The report publishing date is as per the Pacific Time Zone.
Technical Indicators Defined: -
Support: A level at which the stock prices tend to find support if they are falling, and a downtrend may take a pause backed by demand or buying interest. Support 1 refers to the nearby support level for the stock and if the price breaches the level, then Support 2 may act as the crucial support level for the stock.
Resistance: A level at which the stock prices tend to find resistance when they are rising, and an uptrend may take a pause due to profit booking or selling interest. Resistance 1 refers to the nearby resistance level for the stock and if the price surpasses the level, then Resistance 2 may act as the crucial resistance level for the stock.
Stop-loss: It is a level to protect against further losses in case of unfavorable movement in the stock prices.
Kalkine Equities LLC provides general information about companies and their securities. The information contained in the reports, including any recommendations regarding the value of or transactions in any securities, does not take into account any of your investment objectives, financial situation or needs. Kalkine Equities LLC is not registered as an investment adviser in the U.S. with either the federal or state government. Before you make a decision about whether to invest in any securities, you should take into account your own objectives, financial situation and needs and seek independent financial advice. All information in our reports represents our views as at the date of publication and may change without notice.
Kalkine Media LLC, an affiliate of Kalkine Equities LLC, may have received, or be entitled to receive, financial consideration in connection with providing information about certain entity(s) covered on its website.
Past performance is not a reliable indicator of future performance.
 Please wait processing your request...