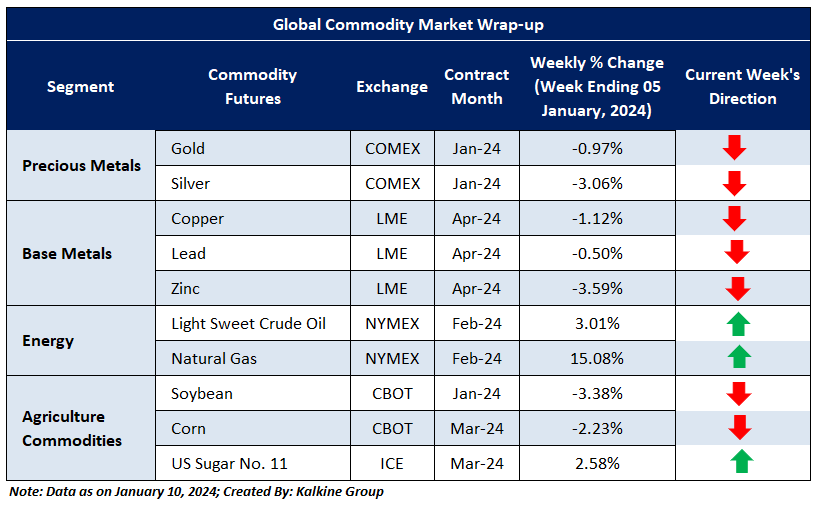
Last week, commodities prices witnessed a mixed reaction with profit booking in metals and a rally in energy. Gold prices price eased from its peak levels, losing momentum and settled with a weekly loss of ~0.97%. Moreover, Silver losses ~3.06% and other base metals also seen profit booking. Base metals ended in a negative gain last week, Lead and Zinc prices witnessed a weekly loss of ~3.59% and ~0.50% and Copper ~1.12%.
On the Energy front, Natural Gas prices continues its rally and settled at a weekly gain of 15.08%. Moreover, Crude Oil prices settled with a weekly gain of 3.01%. Meanwhile, agricultural commodities prices also closed on a negative note, but Sugar managed to give a positive close of 2.58%.
As the holidays are over and volume is expected to increase in the current week. Most commodities are trading with a negative tone. The precious metals prices are trading in a negative direction. On the energy front we have seen a good recovery from lower levels, Corn is near to its support level and expected to give a reversal from its bearish momentum. However, Crude Oil prices are trading in range bound zone with positive momentum. The agricultural commodities basket is trading in a negative tone also.
The upcoming Micro and Macroeconomic events that may impact market sentiments include an update on the US FOMC Meet on Rate Decision, US Core CPI data, Unemployment claim and PMI Data etc.
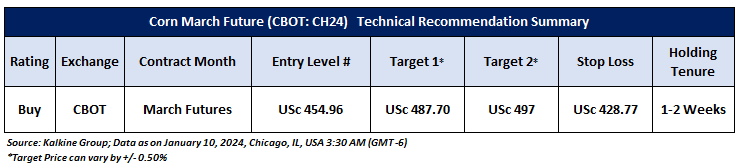
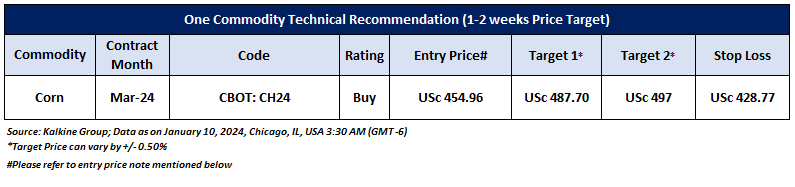
Having understood the global commodities performance over the past week, taking cues from major global economic events, and based on technical analysis, noted below is the recommendation with the generic insights, entry price, target prices, and stop-loss for Corn March Future (CBOT: CH24) for the next 1-2 weeks duration:
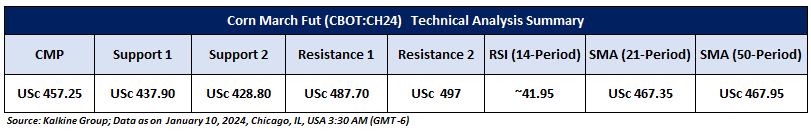
Corn March Future (CBOT: CH24)
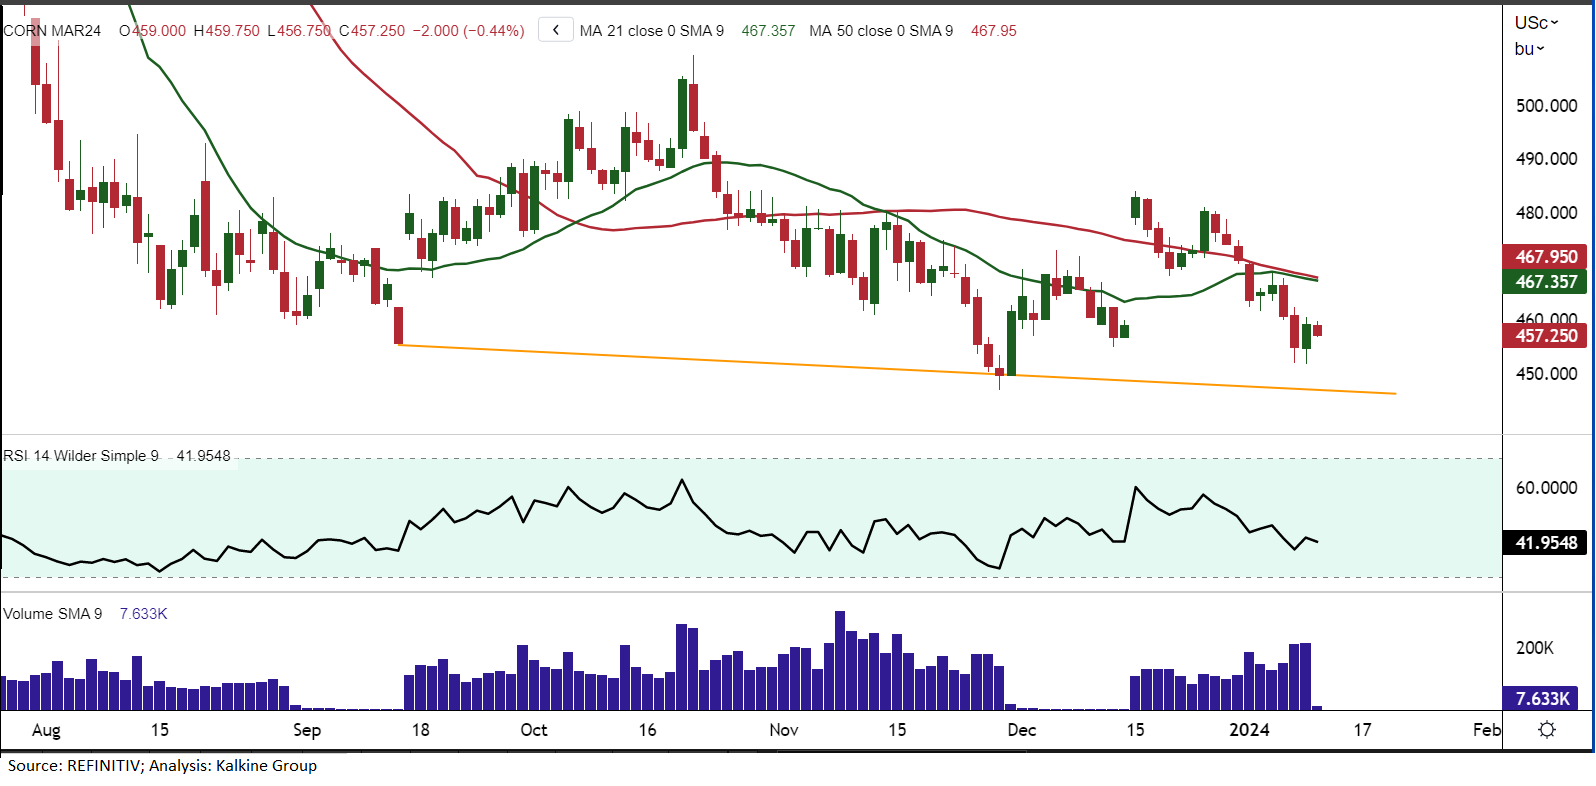
Price Action and Technical Indicator Analysis:
Corn’s March future prices witnessed a profit booking in recent weeks due to lower demand and now trading near its support zone, with a possibility of reversal from the current zone and can demand to normalize. The leading indicator RSI (14-period) shows a reading of ~41.95, indicating price reversal. Further, price will try to retest its SMA line 21-period & 50-period SMAs, which may act as a resistance level.
Now the next crucial resistance levels appear to be at USc 487.70 and USc 497.00, and prices may test these levels in the coming sessions (1-2 weeks).
As per the above-mentioned price action and technical indicators analysis, Corn March Future (CBOT: CH24) is technically well-placed for a ‘Buy’ rating. Investment decisions should be made depending on an individual’s appetite for upside potential, risks, and any previous holdings. This recommendation is purely based on technical analysis, and fundamental analysis has not been considered in this report. Technical summary of the ‘Buy’ recommendation is as follows:
Upcoming Major Global Economic Events
Market events occur on a day-to-day basis depending on the frequency of the data and generally include an update on employment, inflation, GDP, WASDE report, consumer sentiments, etc. Noted below are the upcoming week's major global economic events that could impact the commodities prices:
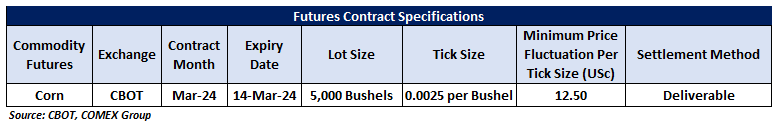
Futures Contract Specifications
Disclaimers
Related Risks: Based on the technical analysis, the risks are defined as per risk-reward ratio (~0.80:1.00), however, returns are generated within a 1-2 weeks’ time frame. This may be looked at by Individuals with sufficient risk appetite looking for returns within short investment duration. The investment recommendations provided in this report are solely based on technical parameters, and the fundamental performance of the commodities has not been considered in the decision-making process. Other factors which could impact on the commodity prices include market risks, regulatory risks, interest rates risk, currency risks, and social and political instability risks etc.
Note 1: Past performance is not a reliable indicator of future performance.
Note 2: Individuals can consider exiting from the commodity if the Target Price mentioned as per the Technical Analysis has been achieved and subject to the factors discussed above.
Note 3: How to Read the Charts?
The Green colour line reflects the 21-period moving average while the red line indicates the 50- period moving average. SMA helps to identify existing price trend. If the prices are trading above the 21-period and 50-period moving average, then it shows prices are currently trading in a bullish trend.
The Black colour line in the chart’s lower segment reflects the Relative Strength Index (14-Period) which indicates price momentum and signals momentum in trend. A reading of 70 or above suggests overbought status while a reading of 30 or below suggests an oversold status.
The Blue colour bars in the chart’s lower segment show the volume of the commodity. Commodity with high volumes is more liquid compared to the lesser ones. Liquidity in commodity helps in easier and faster execution of the order.
The Orange colour lines are the trend lines drawn by connecting two or more price points and used for trend identification purposes. The trend line also acts as a line of support and resistance.
Technical Indicators Defined: -
Support: A level at which the stock prices tend to find support if they are falling, and a downtrend may take a pause backed by demand or buying interest. Support 1 refers to the nearby support level for the stock and if the price breaches the level, then Support 2 may act as the crucial support level for the stock.
Resistance: A level at which the stock prices tend to find resistance when they are rising, and an uptrend may take a pause due to profit booking or selling interest. Resistance 1 refers to the nearby resistance level for the stock and if the price surpasses the level, then Resistance 2 may act as the crucial resistance level for the stock.
Stop-loss: It is a level to protect further losses in case of unfavourable movement in the stock prices.
Risk Reward Ratio: The risk reward ratio is the difference between an entry point to a stop loss and profit level. This report is based on ~80% Stop Loss of the Target 1 from the entry point.
The reference date for all price data, volumes, technical indicators, support, and resistance levels is January 10, 2024 (Chicago, IL, USA 3:30 AM (GMT-6). The reference data in this report has been partly sourced from REFINITIV.
Note: Trading decisions require a thorough analysis by individuals. Technical reports, in general, chart out metrics that may be assessed by individuals before any commodity evaluation. The above are illustrative analytical factors used for evaluating the commodity; other parameters can be looked at along with additional risks per se.
Kalkine Equities LLC provides general information about companies and their securities. The information contained in the reports, including any recommendations regarding the value of or transactions in any securities, does not take into account any of your investment objectives, financial situation or needs. Kalkine Equities LLC is not registered as an investment adviser in the U.S. with either the federal or state government. Before you make a decision about whether to invest in any securities, you should take into account your own objectives, financial situation and needs and seek independent financial advice. All information in our reports represents our views as at the date of publication and may change without notice.
Kalkine Media LLC, an affiliate of Kalkine Equities LLC, may have received, or be entitled to receive, financial consideration in connection with providing information about certain entity(s) covered on its website.
Past performance is not a reliable indicator of future performance.
 Please wait processing your request...