
Company Overview: OneSoft Solutions Inc. (TSXV: OSS) is a dynamic software solutions provider specializing in leveraging Microsoft's cutting-edge Cloud technologies to deliver innovative solutions across select markets. Committed to harnessing the power of cloud computing, OneSoft Solutions designs and develops state-of-the-art software tailored to meet the unique needs of its diverse client base. Faraday Future Intelligent Electric Inc. (NASDAQ: FFIE) is a leading global innovator in the intelligent electric mobility sector. Specializing in cutting-edge artificial intelligence and luxury electric vehicles, the company is at the forefront of designing and engineering advanced, connected transportation solutions. The Report covers the Price Action, Technical Indicators Analysis along with the Stop Loss Levels, Target Prices, and Recommendations on these two stocks.
Global Markets Wrap-Up
On August 08, 2024, the S&P 500 index settled at 5319.31 with a week till date gain of 2.56%; however, the tech-heavy NASDAQ composite declined by ~0.69% on a WTD basis and settled at 16660.02 while, the Russell 2000 settled at 2084.42, reflecting a loss of ~1.18% on WTD basis.
Considering the Canadian market, the benchmark S&P/TSX Venture Composite Index (TSX: ^JX) started the week on a negative note and continued the momentum. On August 08, 2024, the index closed at 541.59 with an overall week-to-date (WTD) loss of 2.52%. Consumer Cyclicals, technology, Industrials, basic materials, consumer Non-cyclicals, energy, and healthcare were the leading sectors, while real estate and financials were the laggards on Thursday.
Considering the US and Canadian markets’ performance over the week, following the significant global macros and data front, two stocks that fit the criteria on the technical framework: OneSoft Solutions Inc. (TSXV: OSS) and Faraday Future Intelligent Electric Inc. (NASDAQ: FFIE). The recommendations on these stocks are based on the generic insights, entry price, target prices, and stop-loss for the next 2-6 weeks:

OneSoft Solutions Inc. (TSXV: OSS)
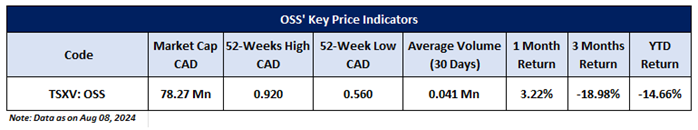
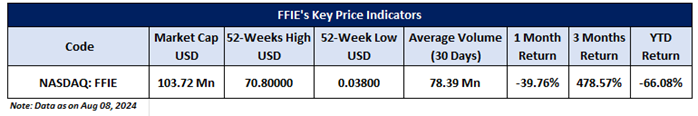
Noted below are the key price indicators for the stock:
Price Action Analysis (on the Weekly Chart)
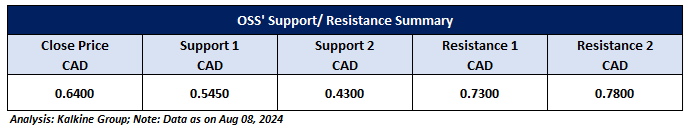
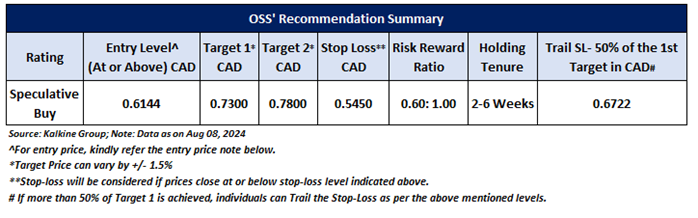
On the weekly chart, OSS stock price is trading above the falling trendline support level, indicating the possibility of an upside movement hereon. The next resistance level is plotted around CAD 0.730, and the price may test this level in the short term (2-6 weeks). A further movement above CAD 0.730 may extend buying in the stock.
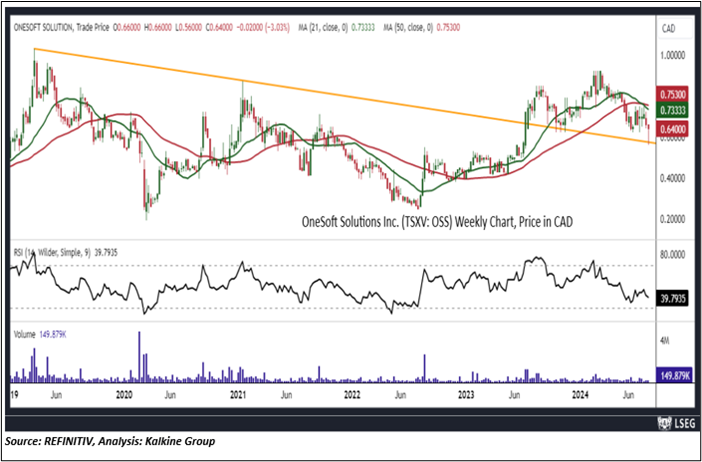
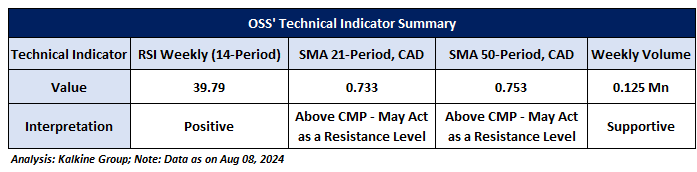
Technical Analysis (On the Weekly Chart)
On the weekly chart, the momentum oscillator RSI (14-Period) is showing a reading of ~39.79 levels, indicating positive momentum. The weekly volumes also seem supportive of an upside movement. However, the current market price (CMP) is below the trend-following indicator 50-period SMA, which may act as the resistance level.
General Recommendation:
As per the above-mentioned price action and technical indicators analysis, OneSoft Solutions Inc. is looking technically well-placed on the chart, and a ‘Speculative Buy’ recommendation has been given on the stock. The summary of recommendations is as follows:
Faraday Future Intelligent Electric Inc. (NASDAQ: FFIE)
Noted below are the key price indicators for the stock:
Price Action Analysis (on the Daily Chart)
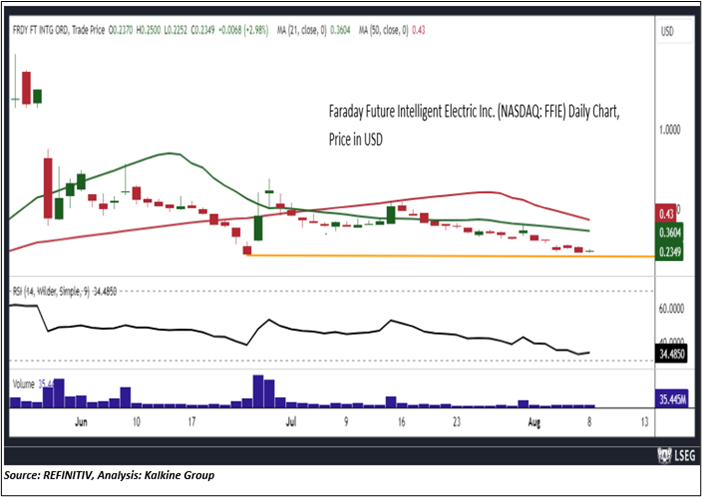
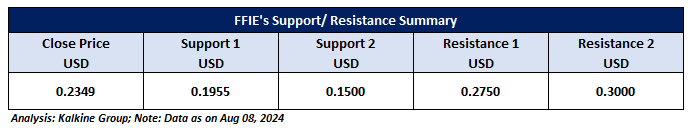
On the daily chart, FFIE stock price is sustaining above the horizontal trendline support level, indicating the possibility of an upside movement hereon. The next resistance level is plotted around USD 0.2750, and the price may test this level in the short term (2-6 weeks). A further movement above USD 0.2750 may extend buying in the stock.
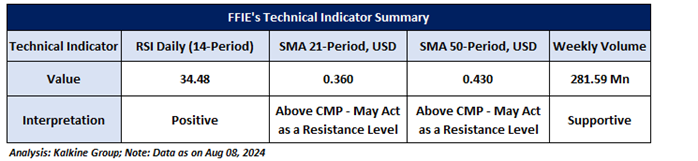
Technical Analysis (On the Daily Chart)
On the daily chart, the momentum oscillator RSI (14-Period) is showing a reading of ~34.48 levels, recovering from the lower level. The weekly volumes also seem supportive of an upside movement. However, the current market price (CMP) is below the trend-following indicator 21-period SMA, which may act as the resistance level.
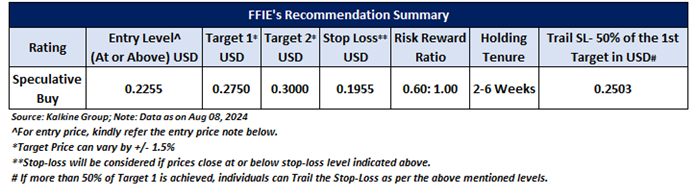
General Recommendation:
As per the above-mentioned price action and technical indicators analysis, Faraday Future Intelligent Electric Inc. is looking technically well-placed on the chart, and a ‘Speculative Buy’ recommendation has been given on the stock. The summary of recommendations is as follows:
Investment decisions should be made depending on an individual's appetite for upside potential, risks, and any previous holdings. This recommendation is purely based on technical analysis, and fundamental analysis has not been considered in this report.
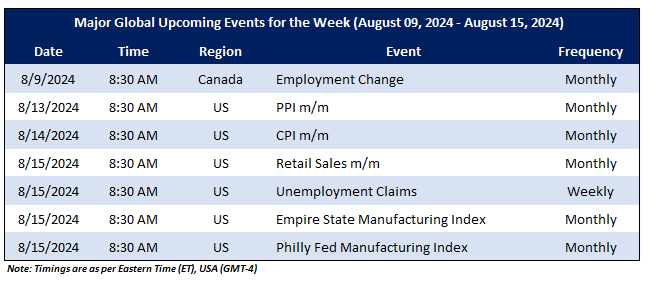
Upcoming Major Global Economic Events
Market events occur daily depending on the data's frequency and generally include updates on CPI, PPI, Core Retail Sales, Unemployment Data, etc. The upcoming week's major global economic events that could impact the S&P/TSX Venture Composite Index and listed stocks' prices are noted below.
Related Risks: This report may be looked at from a high-risk perspective and recommendation is provided for a short duration. Recommendations provided in this report are solely based on technical parameters, and the fundamental performance of the stocks has not been considered in the decision-making process. Other factors which could impact the stock prices include market risks, regulatory risks, interest rates risks, currency risks, social and political instability risks etc.
Markets are trading in a highly volatile zone currently due to certain macro-economic issues and geopolitical tensions prevailing. Therefore, it is prudent to follow a cautious approach while investing.
Note 1: Individuals can consider exiting from the stock if the Target Price or Stop loss mentioned as per the technical analysis has been achieved and subject to the factors discussed above.
Note 2: How to Read the Charts?
The Green color line reflects the 21-period moving average, while the red color line indicates the 50-period moving average. SMA helps to identify existing price trend. If the prices are trading above the 21-period and 50-period moving average, then it shows prices are currently trading in a bullish trend.
The Black color line in the chart's lower segment reflects the Relative Strength Index (14-Period), which indicates price momentum and signals momentum in trend. A reading of 70 or above suggests overbought status, while a reading of 30 or below suggests an oversold status.
The Blue color bars in the chart's lower segment show the volume of the stock. The volume is the number of shares that changed hands during a given day. Stocks with high volumes are more liquid than stocks with lesser volume. Liquidity in stocks helps in easier and faster execution of the order.
The Orange color lines are the trend lines drawn by connecting two or more price points and used for trend identification purposes. The trend line also acts as a line of support and resistance.
Technical Indicators Defined: -
Support: A level at which the stock prices tend to find support if they are falling, and a downtrend may take a pause backed by demand or buying interest. Support 1 refers to the nearby support level for the stock and if the price breaches the level, then Support 2 may act as the crucial support level for the stock.
Resistance: A level at which the stock prices tend to find resistance when they are rising, and an uptrend may take a pause due to profit booking or selling interest. Resistance 1 refers to the nearby resistance level for the stock and if the price surpasses the level, then Resistance 2 may act as the crucial resistance level for the stock.
Stop-loss: In general, it is a level to protect further losses in case of unfavorable movement in the stock prices.
Risk Reward Ratio: The risk reward ratio is the difference between an entry point to a stop loss and profit level and the report is based on ~60% Stop Loss of the Target 1 from the entry point.
A trailing stop-loss is a modification of stop-loss in case of favorable movement in the price to protect the gains. Individual can Trail the Stop-Loss as per the levels if the stock price achieves more than 50% of the Target 1. Individual should consider exiting from the position as per the Trailing Stop-Loss level if the price starts moving downwards after achieving more than 50% of the Target 1.
The reference date for all price data, currency, technical indicators, support, and resistance levels is August 08, 2024. The reference data in this report has been partly sourced from REFINITIV.
Abbreviations
CMP: Current Market Price
SMA: Simple Moving Average
CAD: Canadian Dollar
RSI: Relative Strength Index
USD: United States dollar
Note: Trading decisions require a thorough analysis by individuals. Technical reports in general chart out metrics that may be assessed by individuals before any stock evaluation. The above are illustrative analytical factors used for evaluating the stocks; other parameters can be looked at along with additional risks per se. Past performance is neither an indicator nor a guarantee of future performance.
Kalkine Equities LLC, with Delaware File Number 4697384, Foreign Qualification Registration in California File Number 202109211078, and Texas File Number 805521396, is authorized to provide general advice only. The information on https://kalkine.com/ does not take into account any of your investment objectives, financial situation or needs. You should consider the appropriateness of advice taking into account your own objectives, financial situation and needs and seek independent financial advice before making any financial decisions. The link to our Terms and Conditions and Privacy Policy has been provided for your reference. On the date of publishing the reports (mentioned on the website), employees and/or associates of Kalkine do not hold positions in any of the stocks covered on the website. These stocks can change any time and readers of the reports should not consider these stocks as advice or recommendations later.
Copyright © 2024 Krish Capital Pty Ltd. All rights reserved.
Past performance is not a reliable indicator of future performance.
 Please wait processing your request...