
Section 1: Company Overview and Fundamentals
1.1 Company Overview:
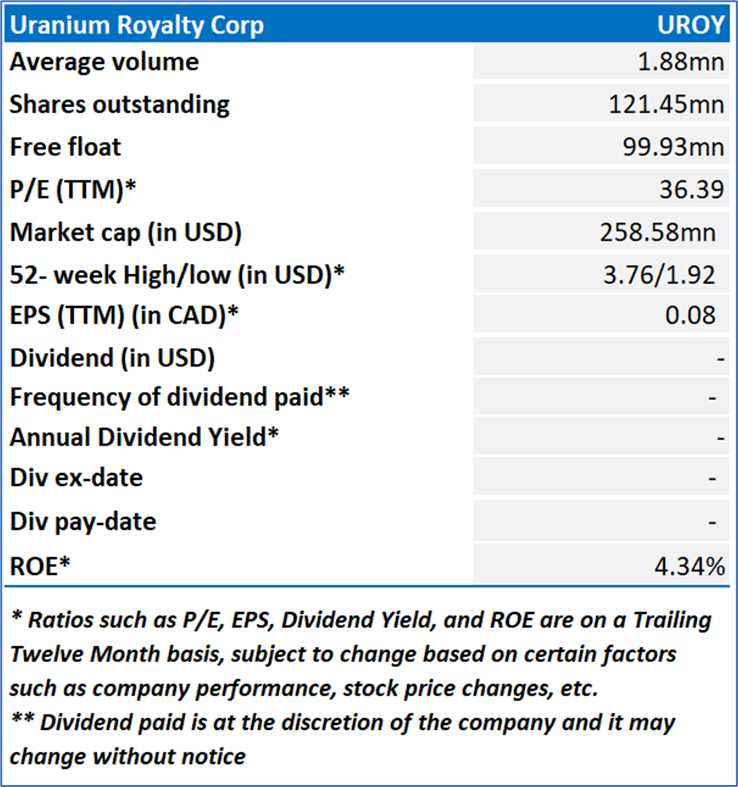
Uranium Royalty Corp. (NASDAQ: UROY) is a uranium-focused royalty and streaming company. The Company is focused on gaining exposure to uranium prices by making strategic investments in uranium interests, including royalties, streams, debt and equity investments in uranium companies, as well as through holdings of physical uranium. Its portfolio includes Anderson, Church Rock, Cigar Lake/Waterbury Lake, Dawn Lake, Dewey-Burdock, Energy Queen, Lance, Langer Heinrich, McArthur River, Michelin, Reno Creek and others.
Kalkine’s Diversified Opportunities Report covers the Company Overview, Key positives & negatives, Investment summary, Key investment metrics, Top 10 shareholding, Business updates and insights into company recent financial results, Key Risks & Outlook, Price performance and technical summary, Target Price, and Recommendation on the stock.
Stock Performance:
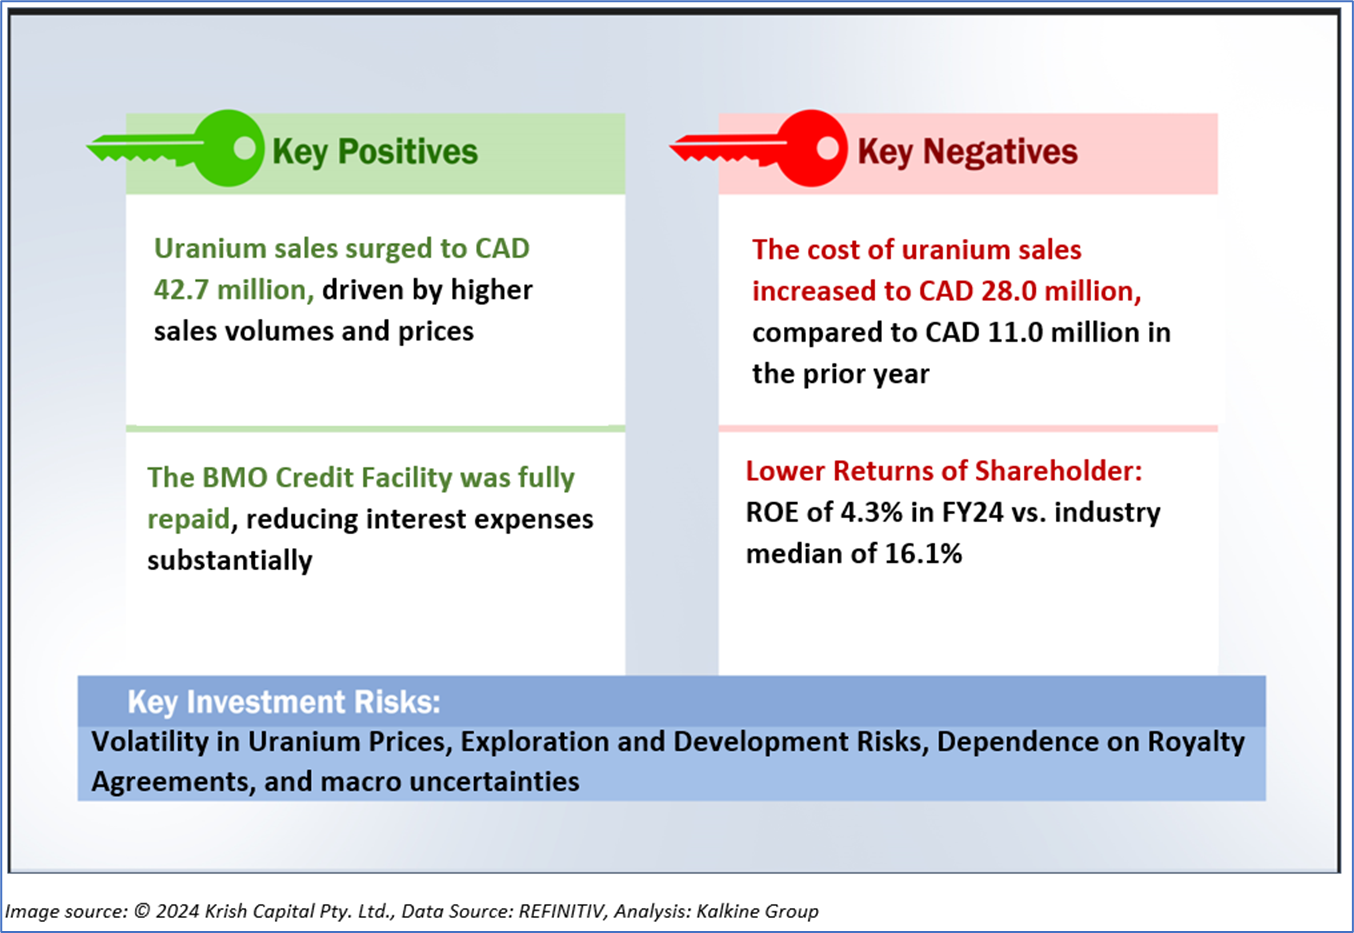
1.2 The Key Positives, Negatives, and Investment summary
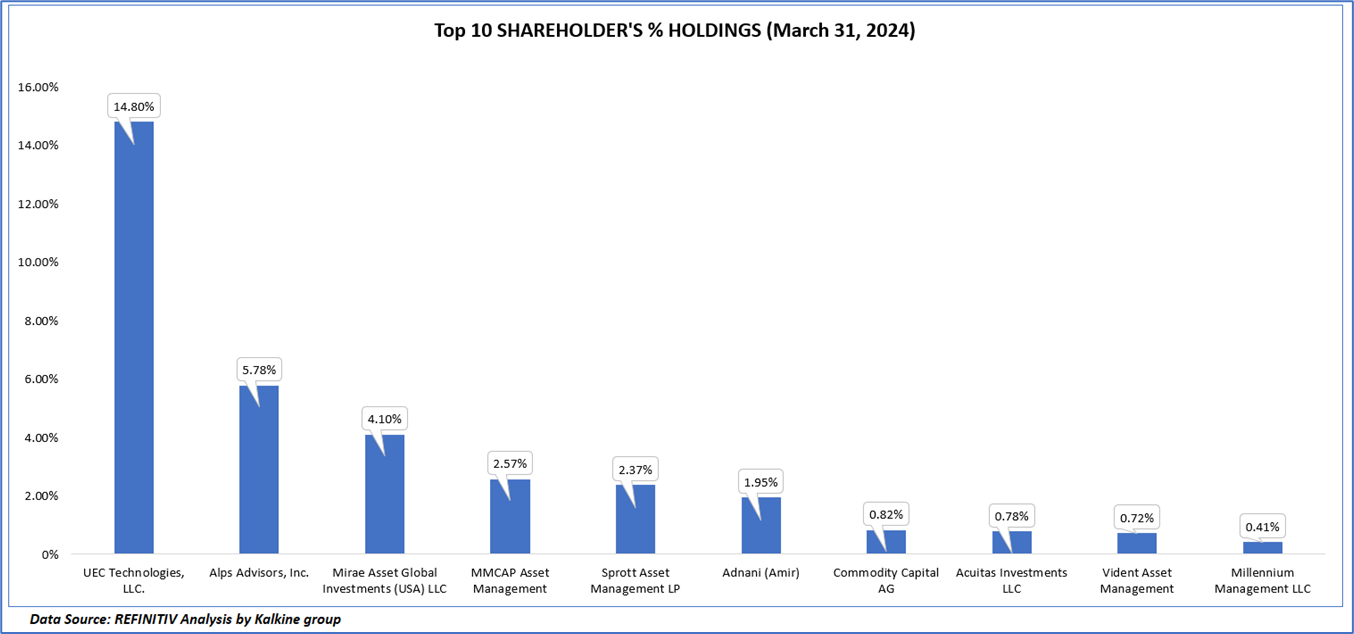
1.3 Top 10 shareholders:
The top 10 shareholders together form ~34.31% of the total shareholding, signifying concentrated shareholding. UEC Technologies, LLC., and Alps Advisors, Inc. are the biggest shareholders, holding the maximum stake in the company at 14.80% and 5.78%, respectively.
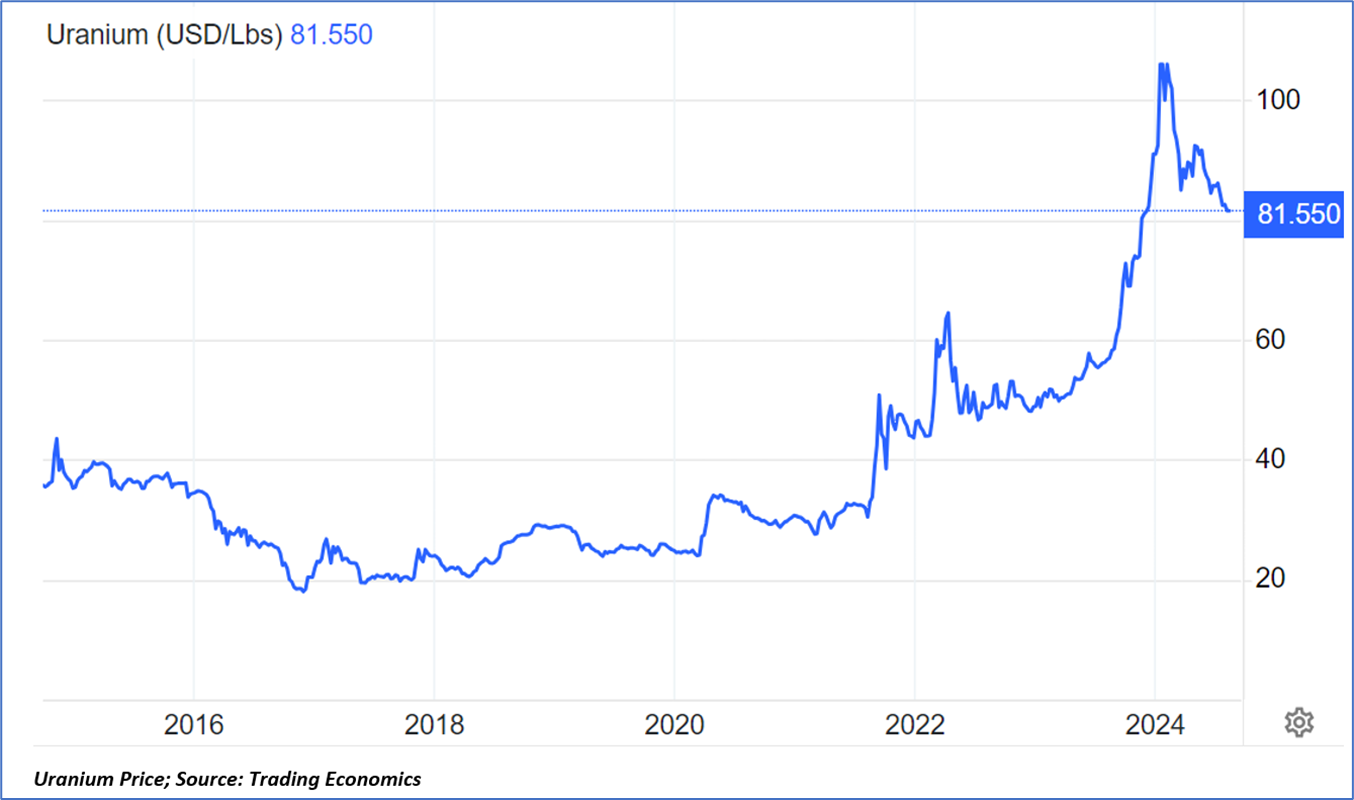
1.4 Underlying Commodity Analysis:
In August, uranium prices dropped to USD 81 per pound, marking the lowest level in nine months, as concerns about supply risks began to ease. The United States Department of Energy continued its efforts to tender low-enriched uranium for nuclear power, aiming to assess domestic capacity in the wake of the government’s ban on Russian nuclear fuel imports. Previously, Russia supplied nearly half of the US nuclear fuel, and several European utilities have already voluntarily ceased importing uranium from Russia. This capacity assessment was intended to determine the extent of necessary waivers to the import ban, mitigating fears of supply shortages.
Meanwhile, Kazatomprom, the world’s largest uranium producer, reported an increase in production during the first half of the year. Consequently, the state-owned company revised its production outlook upwards for the remainder of 2024. This alleviated concerns regarding reduced supply from Kazakhstan, following the country’s unexpected imposition of a mineral extraction tax on uranium products.
Section 2: Business Updates and Corporate Business Highlights
2.1 Recent Updates:
The below picture gives an overview of the recent updates:

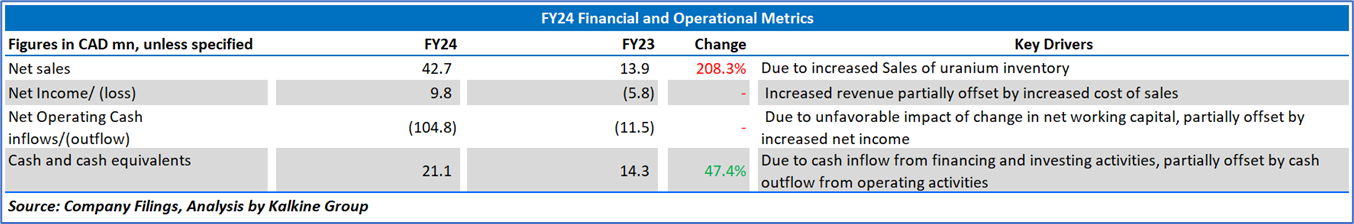
2.2 Insights of FY24:
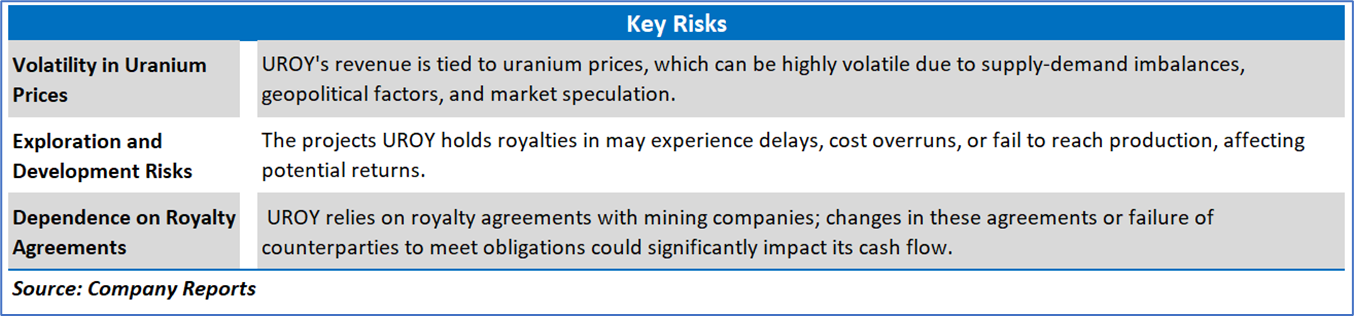
Section 3: Key Risks & Outlook
Section 4: Stock Recommendation Summary:
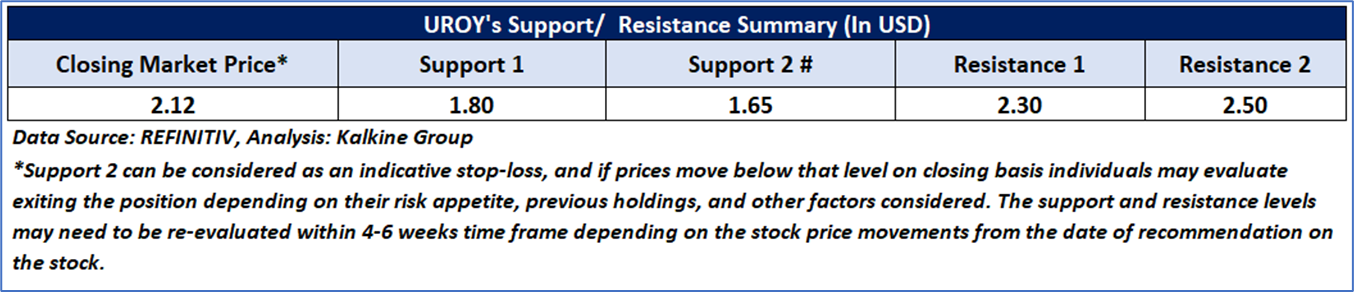
4.1 Price Performance and Technical Summary:
Stock Performance:

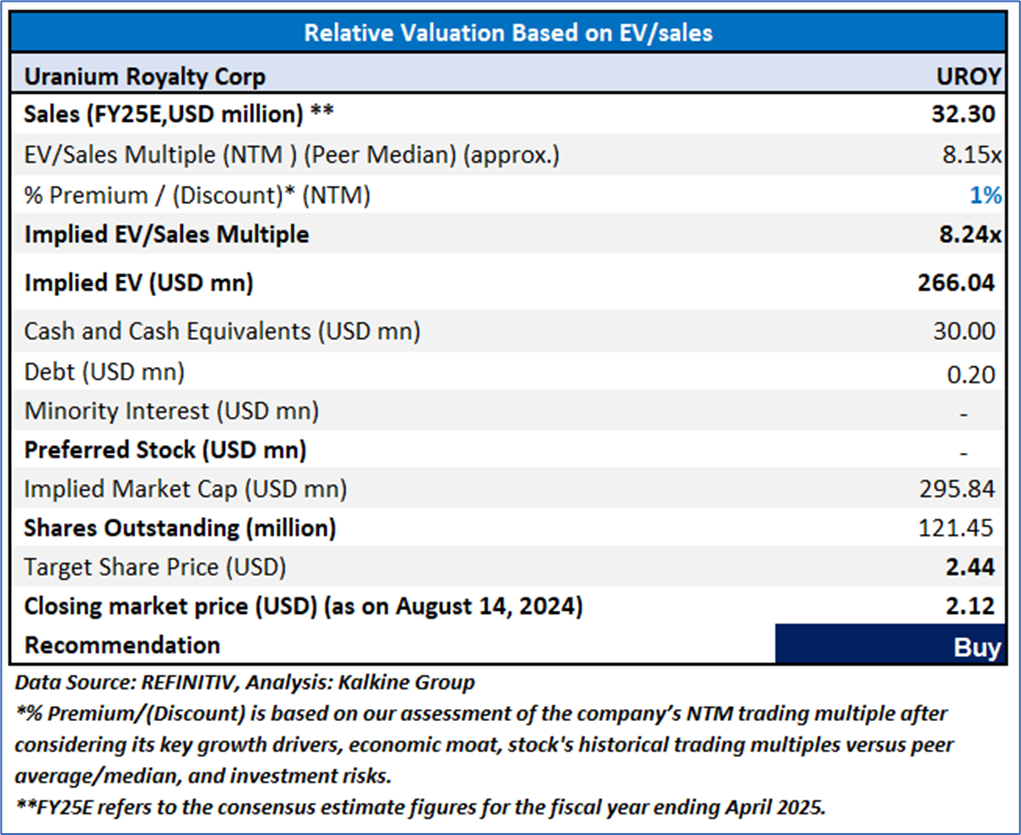
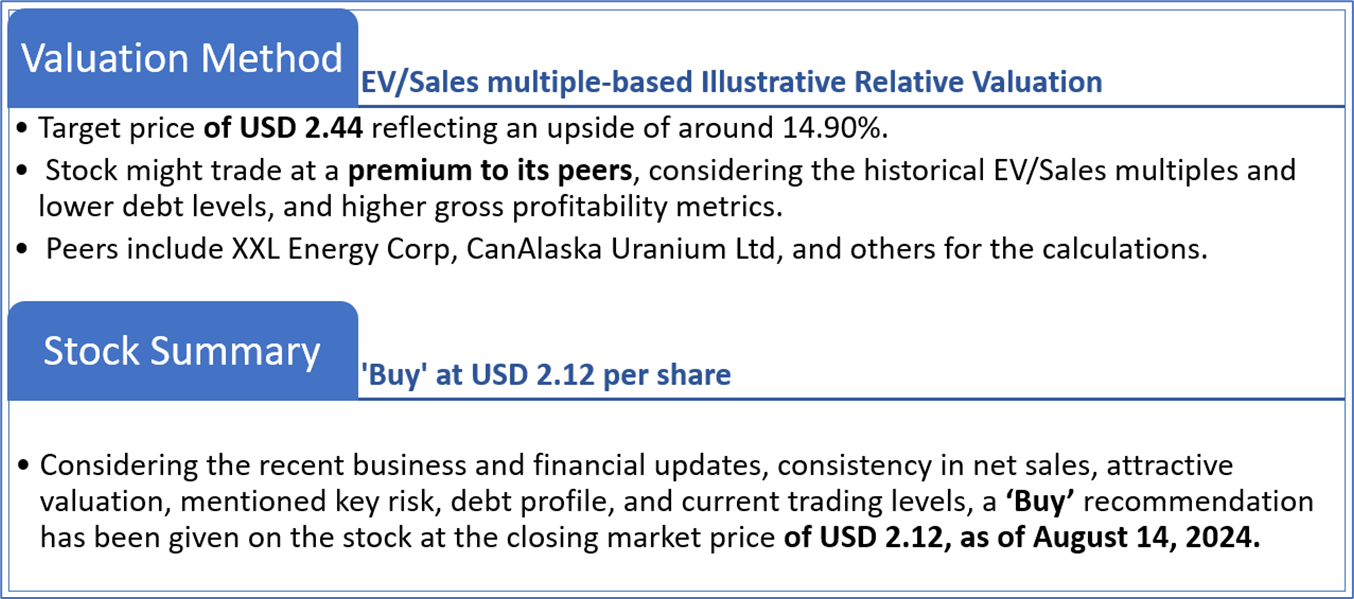
4.2 Fundamental Valuation
Valuation Methodology: EV/Sales Multiple Based Relative Valuation
Markets are trading in a highly volatile zone currently due to certain macroeconomic issues and geopolitical tensions prevailing. Therefore, it is prudent to follow a cautious approach while investing.
Note 1: Past performance is not a reliable indicator of future performance.
Note 2: The reference date for all price data, currency, technical indicators, support, and resistance levels is August 14, 2024. The reference data in this report has been partly sourced from REFINITIV.
Note 3: Investment decisions should be made depending on an individual's appetite for upside potential, risks, holding duration, and any previous holdings. An 'Exit' from the stock can be considered if the Target Price mentioned as per the Valuation and or the technical levels provided has been achieved and is subject to the factors discussed above.
Note 4: The report publishing date is as per the Pacific Time Zone.
Technical Indicators Defined: -
Support: A level at which the stock prices tend to find support if they are falling, and a downtrend may take a pause backed by demand or buying interest. Support 1 refers to the nearby support level for the stock and if the price breaches the level, then Support 2 may act as the crucial support level for the stock.
Resistance: A level at which the stock prices tend to find resistance when they are rising, and an uptrend may take a pause due to profit booking or selling interest. Resistance 1 refers to the nearby resistance level for the stock and if the price surpasses the level, then Resistance 2 may act as the crucial resistance level for the stock.
Stop-loss: It is a level to protect against further losses in case of unfavorable movement in the stock prices.
Kalkine Equities LLC, with Delaware File Number 4697384, Foreign Qualification Registration in California File Number 202109211078, and Texas File Number 805521396, is authorized to provide general advice only. The information on https://kalkine.com/ does not take into account any of your investment objectives, financial situation or needs. You should consider the appropriateness of advice taking into account your own objectives, financial situation and needs and seek independent financial advice before making any financial decisions. The link to our Terms and Conditions and Privacy Policy has been provided for your reference. On the date of publishing the reports (mentioned on the website), employees and/or associates of Kalkine do not hold positions in any of the stocks covered on the website. These stocks can change any time and readers of the reports should not consider these stocks as advice or recommendations later.
Copyright © 2024 Krish Capital Pty Ltd. All rights reserved.
Past performance is not a reliable indicator of future performance.
 Please wait processing your request...