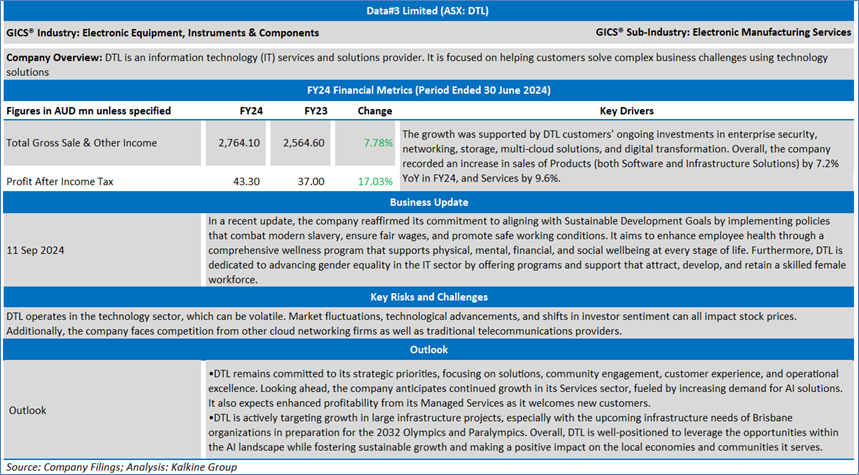
Company Overview: Overview: Data#3 Limited (ASX: DTL) is an information technology (IT) services and solutions provider. It is focused on helping customers solve complex business challenges using technology solutions. Dug Technology Limited (ASX: DUG) is a tech-based company that delivers hardware and software solutions for the technology and resource sectors in Australia, the United States, the United Kingdom, Malaysia, and the United Arab Emirates. Their offerings include high-performance computing as a service, data center cooling solutions, scientific data analysis services, and DUG Insight. This Global Artificial Intelligence & Emerging Technologies Report covers the Company Overview & Price performance, Summary table, Key positives & negatives, Key metrics, Company details, technical guidance & Stock recommendation, and Price chart.

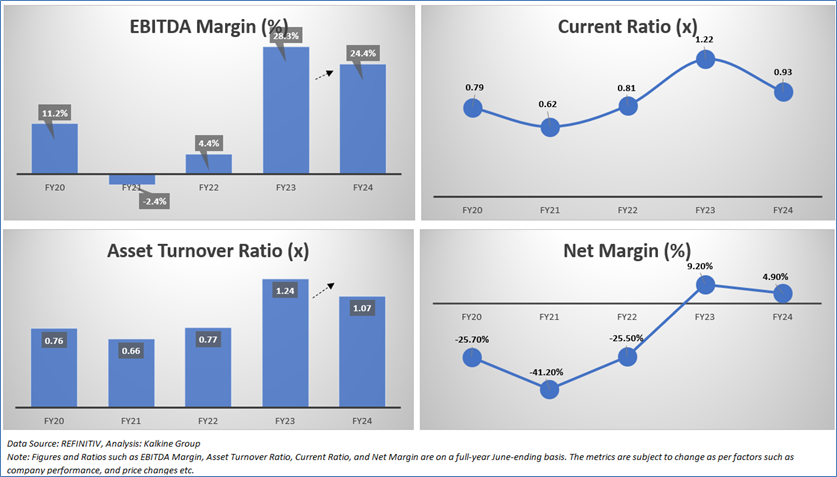
Section 1.0: Key Metrics in Pictures
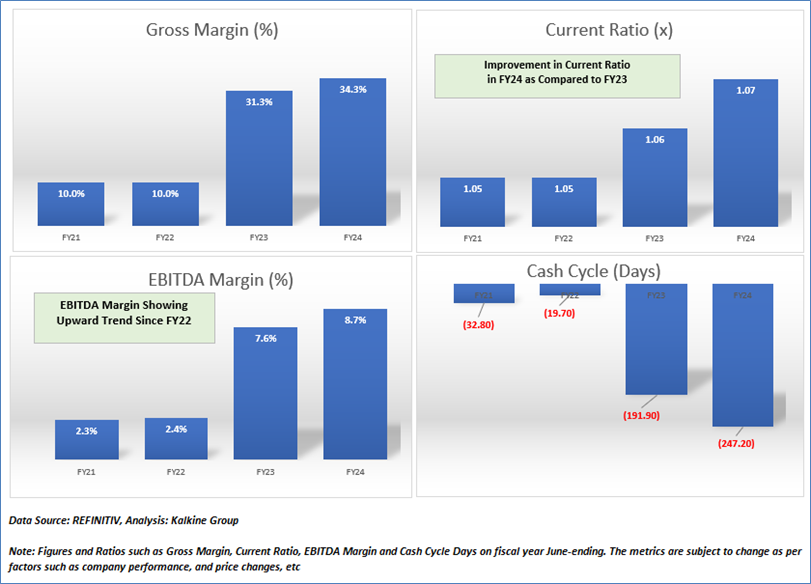
Having looked at the key financial metrics above the below sections provide in-depth fundamental, and technical analysis on this Software & Services stock along with recommendation, technical support, and resistance level & indicative stop-loss.
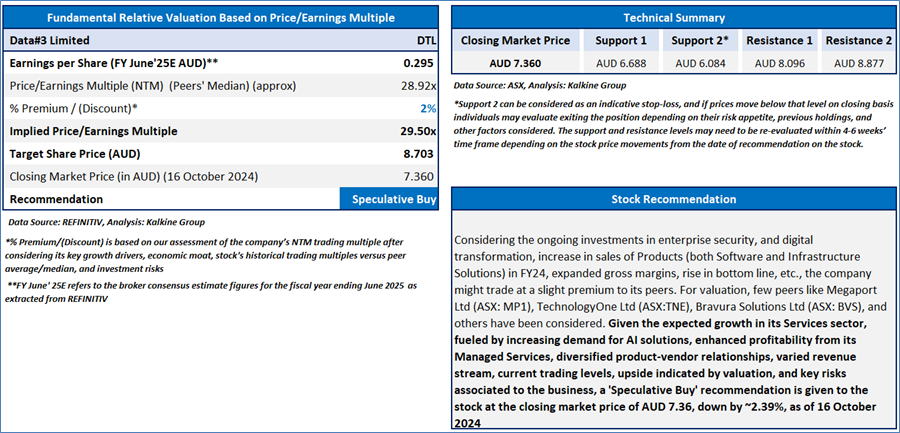
Section 2.0: Data#3 Limited (‘Speculative Buy’ at AUD 7.36, closing market price per share as on 16 October 2024)
2.1 Company Details

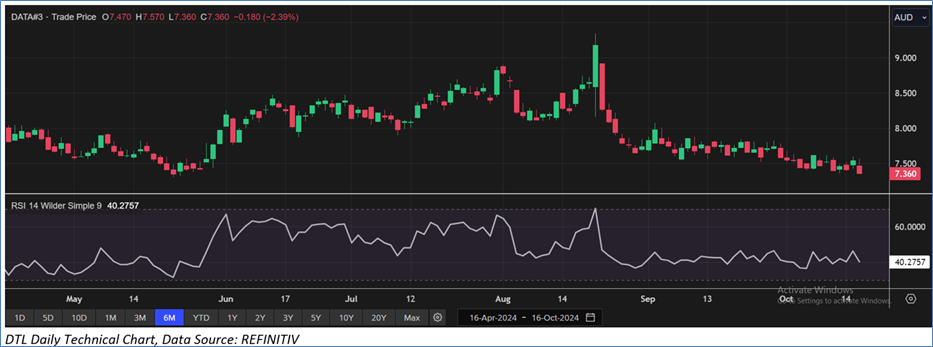
2.2 Valuation, Technical Summary & Stock Recommendation
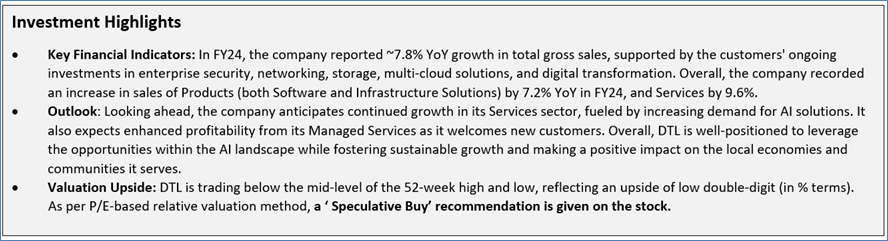
The stock has decreased by ~4.3% in last one month, and over the last three months, it has moved down by ~12.8%. The stock has a 52-week low and 52-week high of AUD 6.77 and AUD 10.01, respectively and is currently trading below the 52-week high-low average. DTL was last covered in a report dated ’16 August 2024’.
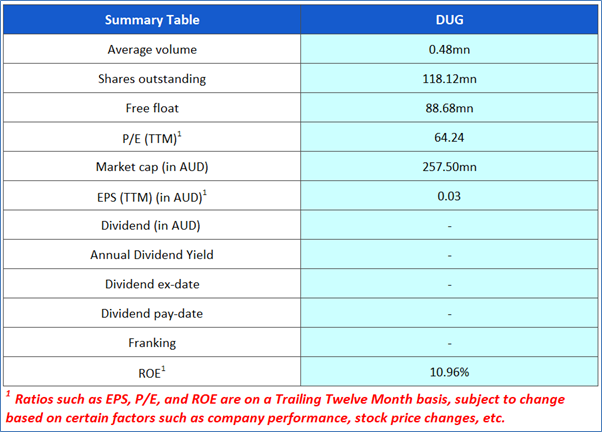
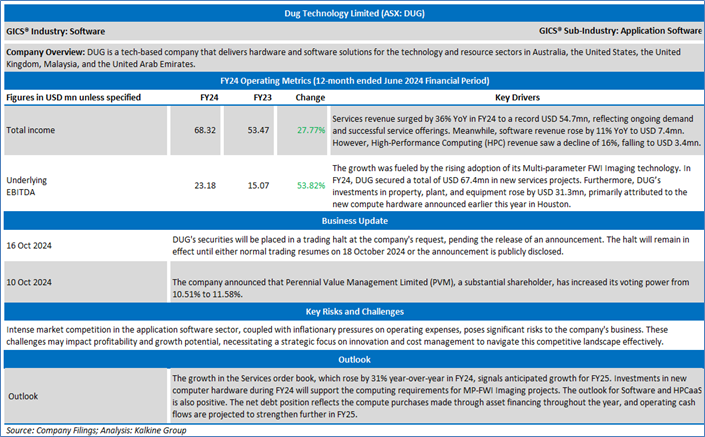
Dug Technology Limited (ASX: DUG)

Section 3.0: Key Metrics in Pictures
Having looked at the key financial metrics above the below sections provide in-depth fundamental, and technical analysis on this Technology Stock along with recommendation, technical support, and resistance level & indicative stop-loss.
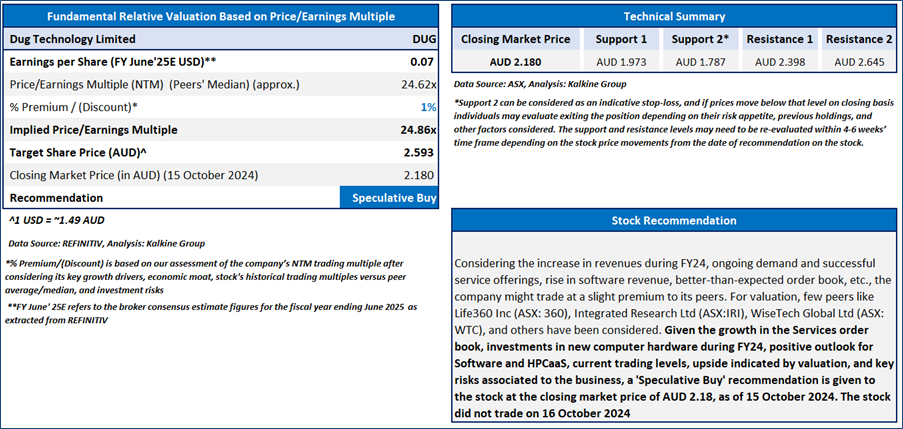
Section 4.0: Dug Technology Limited (‘Speculative Buy’ at AUD 2.18, closing market price per share as on 15 October 2024)
4.1 Company Details
4.2 Valuation, Technical Summary & Stock Recommendation
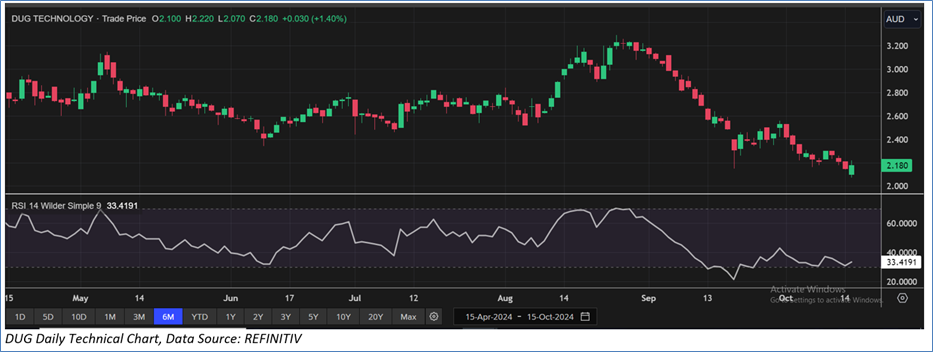
The stock has decreased by ~22.6% in last three months, and over the last six months, it has moved down by ~25.1%. The stock has a 52-week low and 52-week high of AUD 1.575 and AUD 3.290, respectively and is currently trading below the 52-week high-low average. DUG was last covered in a report dated ’19 September 2024’.
Markets are trading in a highly volatile zone currently due to certain macro-economic issues and geopolitical issues prevailing geopolitical tensions. Therefore, it is prudent to follow a cautious approach while investing.
Note 1: Past performance is neither an Indicator nor a guarantee of future performance.
Note 2: The reference date for all price data, currency, technical indicators, support, and resistance levels is 16 October 2024. The reference data in this report has been partly sourced from REFINITIV.
Note 3: Investment decisions should be made depending on an individual’s appetite for upside potential, risks, holding duration, and any previous holdings. An ‘Exit’ from the stock can be considered if the Target Price mentioned as per the Valuation and or the technical levels provided has been achieved and is subject to the factors discussed above.
Note 4: Dividend Yield may vary as per the stock price movement.
Technical Indicators Defined: -
Support: A level at which the stock prices tend to find support if they are falling, and a downtrend may take a pause backed by demand or buying interest. Support 1 refers to the nearby support level for the stock and if the price breaches the level, then Support 2 may act as the crucial support level for the stock.
Resistance: A level at which the stock prices tend to find resistance when they are rising, and an uptrend may take a pause due to profit booking or selling interest. Resistance 1 refers to the nearby resistance level for the stock and if the price surpasses the level, then Resistance 2 may act as the crucial resistance level for the stock.
Stop-loss: It is a level to protect further losses in case of unfavourable movement in the stock prices.
Kalkine Equities LLC, with Delaware File Number 4697384, Foreign Qualification Registration in California File Number 202109211078, and Texas File Number 805521396, is authorized to provide general advice only. The information on https://kalkine.com/ does not take into account any of your investment objectives, financial situation or needs. You should consider the appropriateness of advice taking into account your own objectives, financial situation and needs and seek independent financial advice before making any financial decisions. The link to our Terms and Conditions and Privacy Policy has been provided for your reference. On the date of publishing the reports (mentioned on the website), employees and/or associates of Kalkine do not hold positions in any of the stocks covered on the website. These stocks can change any time and readers of the reports should not consider these stocks as advice or recommendations later.
Copyright © 2024 Krish Capital Pty Ltd. All rights reserved.
Past performance is not a reliable indicator of future performance.
 Please wait processing your request...