
Kalkine’s Global Tariff Report provides fully independent analysis and data-driven analysis of major global sectors affected by tariff changes, evaluating the implications these shifts may have on equity valuations across those industries. The report concentrates on trade-sensitive sectors that typically experience heightened investor scrutiny during periods of tariff uncertainty. It also identifies defensive and countercyclical segments that demonstrate relative resilience or may even outperform, amid disruptions to global trade flows.
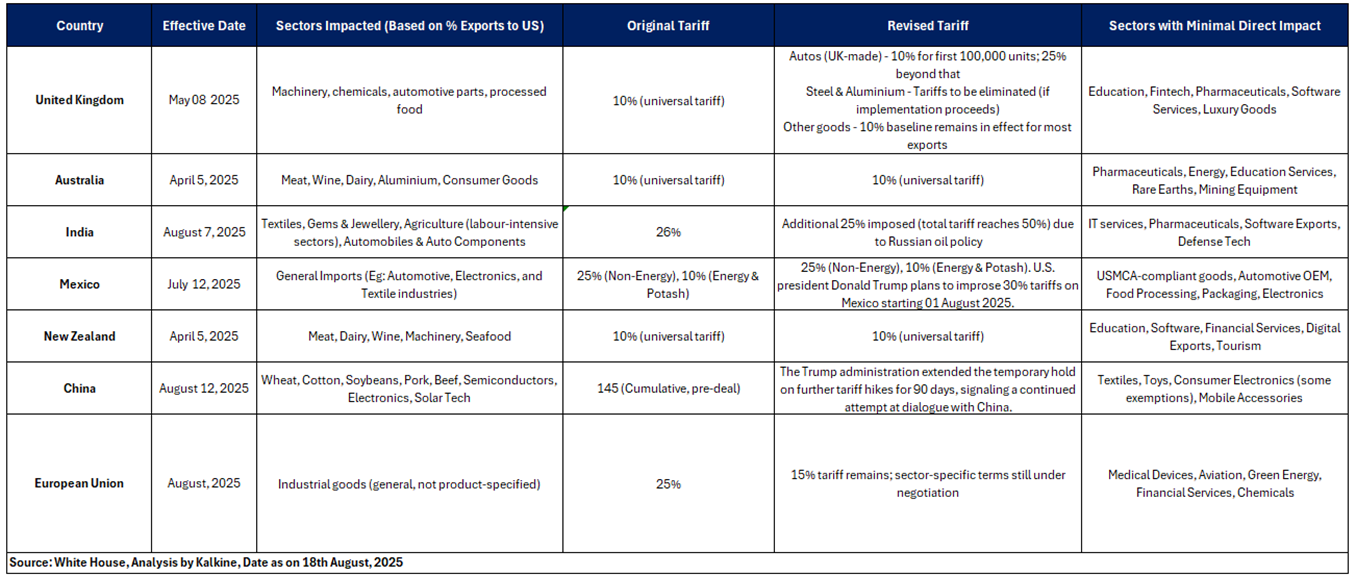
As illustrated in the table below, several key sectors in different countries are directly impacted by the recent tariff announcement from President Trump.


The UK closed July 2025 with a trade deficit of GBP ~10.20 bn. Total exports reached GBP ~228.00 billion, while imports stood at GBP ~238.20 billion.
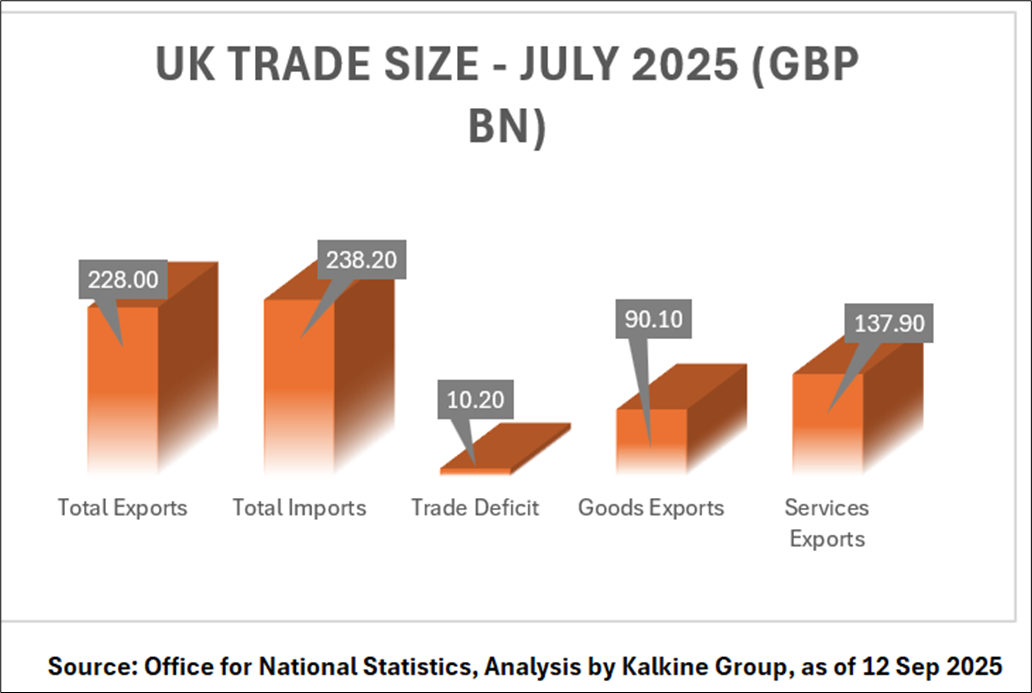
Image source: © 2025 Krish Capital Pty. Ltd., Data Source: REFINITIV, Analysis: Kalkine Group

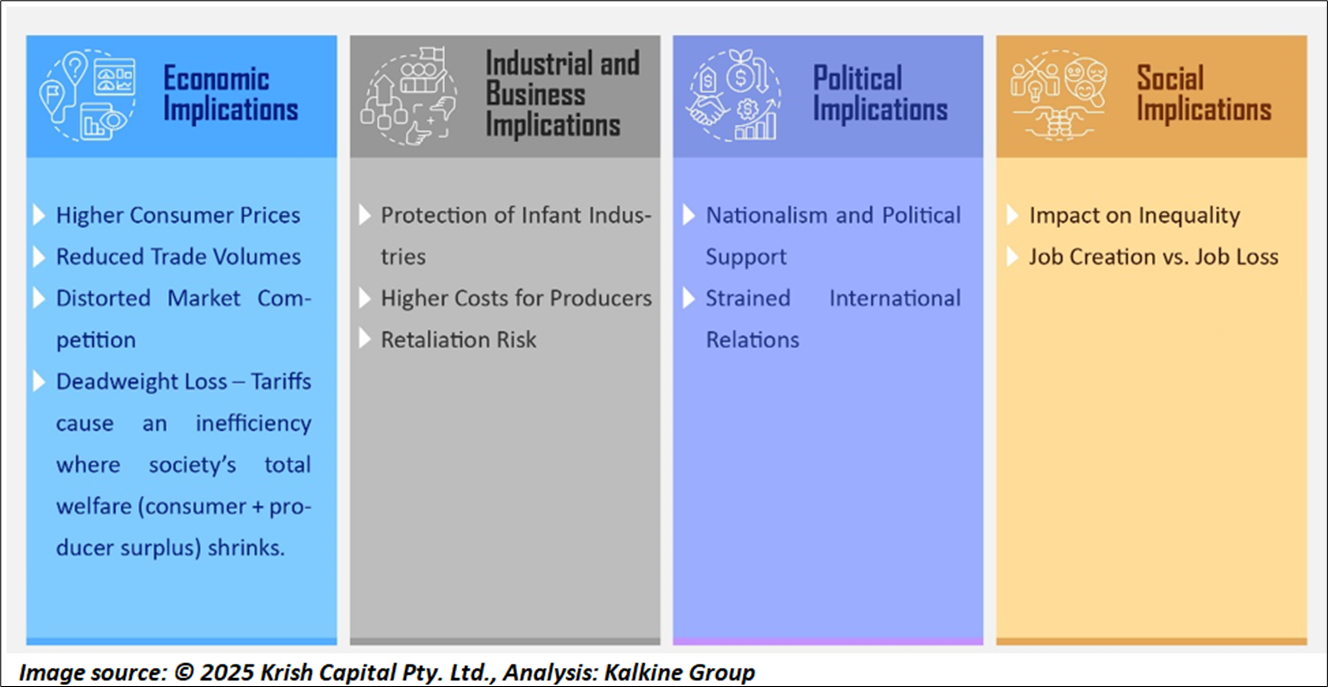

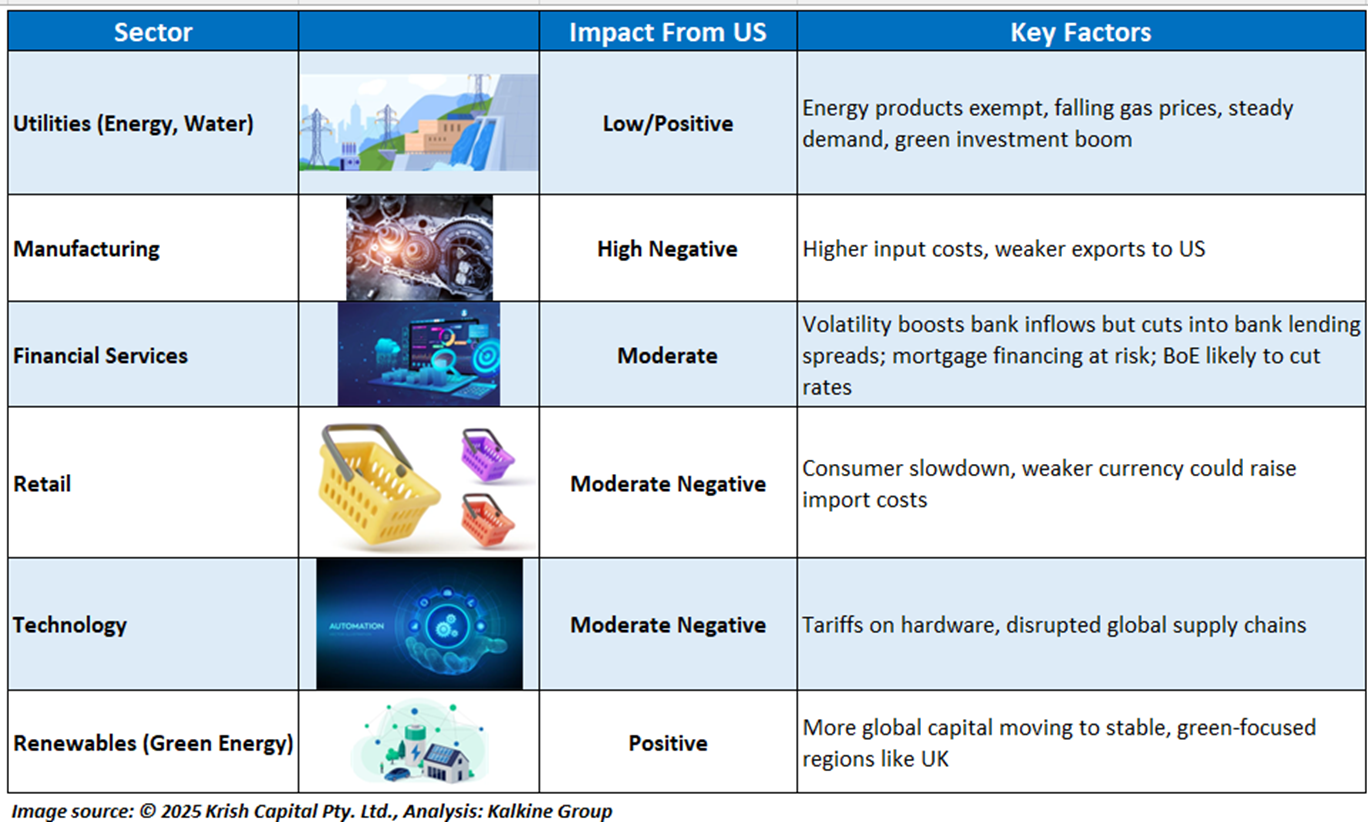

Image source: © 2025 Krish Capital Pty. Ltd., Data Source: REFINITIV, Analysis: Kalkine Group
Image source: © 2025 Krish Capital Pty. Ltd., Data Source: REFINITIV, Analysis: Kalkine Group
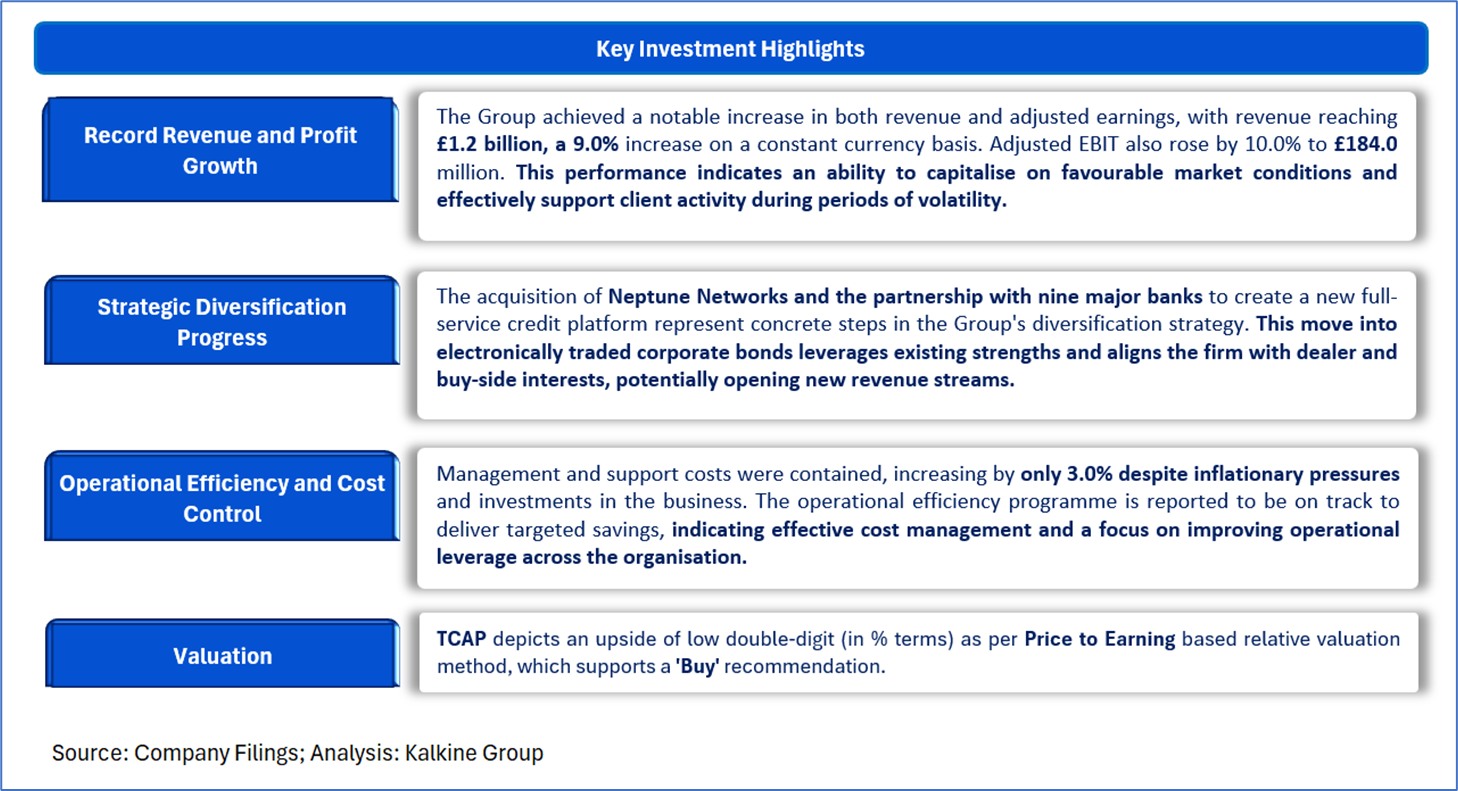
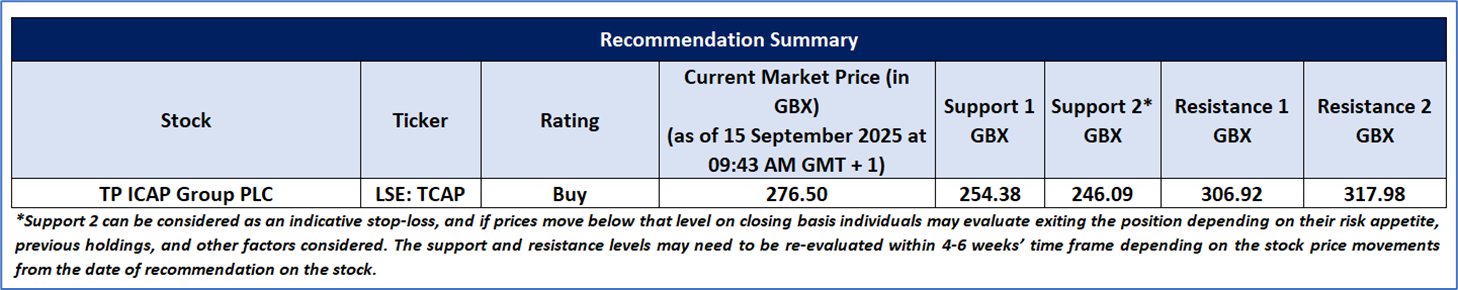
Amid elevated Market Volatility and Tariff pressures, TP ICAP Group PLC (LSE: TCAP) stands out as our defensive pick within the Financial sector, supported by rigorous fundamental and technical research.
Section1: Company Overview and Fundamental Insights:

TP ICAP Group PLC
TP ICAP Group PLC (LSE: TCAP) is a company on the FTSE 250 that builds platforms and provides data for financial markets. Its main job is to bring buyers and sellers together in areas like stocks, bonds, oil, and gas. It does this through its different business units: Global Broking, Energy & Commodities, Liquidnet, and Parameta Solutions.
Kalkine’s Global Tariff Report covers the Investment Highlights, Key Financial Metrics, Risks, and Recent Business Updates along with the Valuation, Target Price, and Recommendation on the stock.
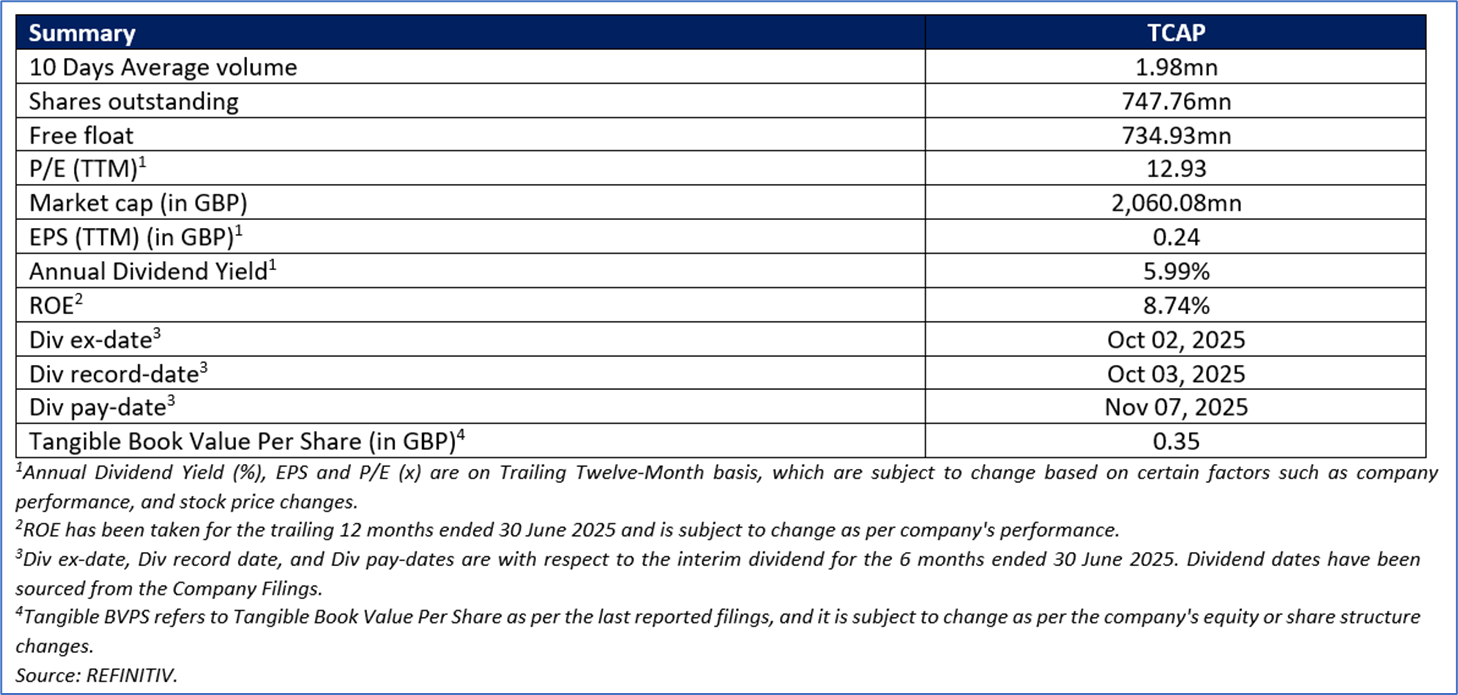


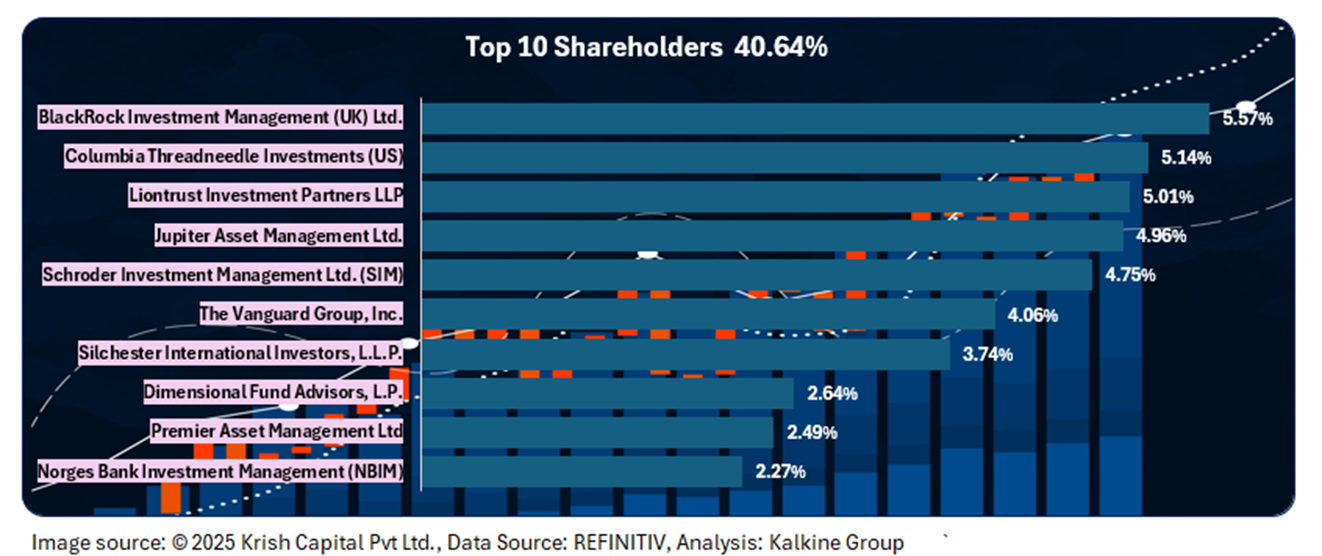
The top 10 shareholders together form ~40.64% of the total shareholding. BlackRock Investment Management (UK) Ltd. and Columbia Threadneedle Investments (US) hold a maximum stake in the company at ~5.57% and ~5.14%, respectively.

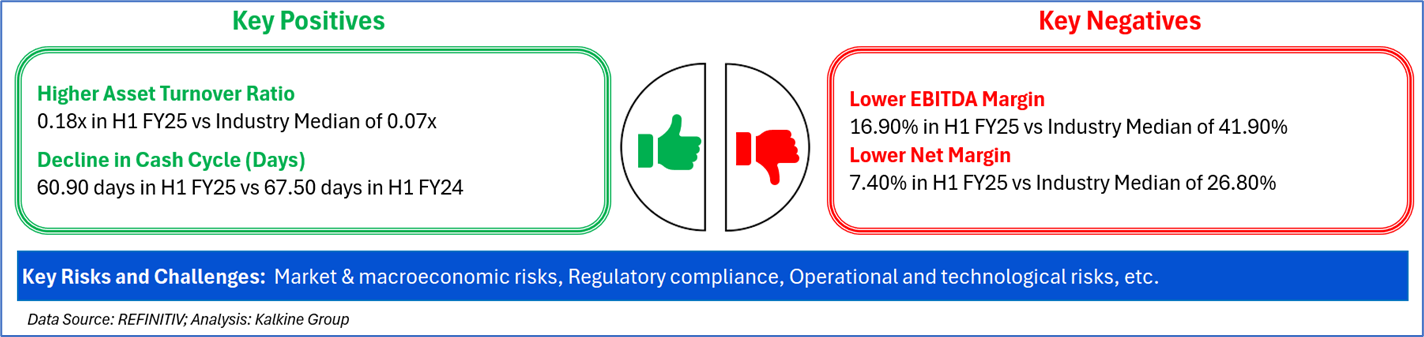
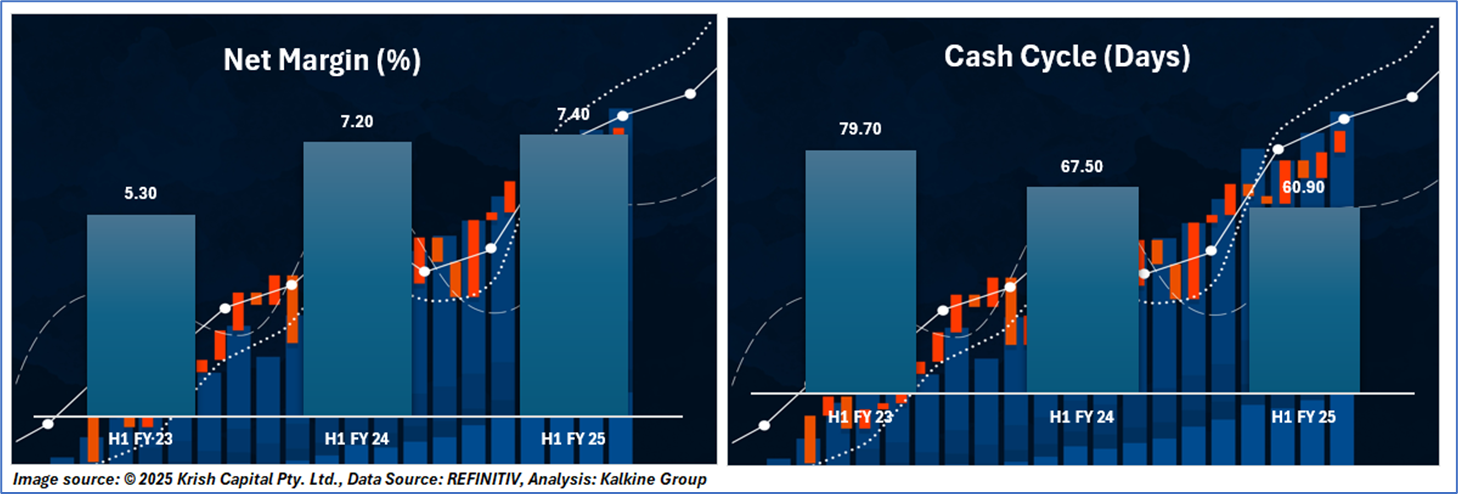
In H1 FY25, the net margin increased to 7.40%, indicating a enhanced profitability & efficiency. The cash cycle also declined to 60.90 days, indicating an improved level of liquidity.
Below charts data are compared on year-on-year basis
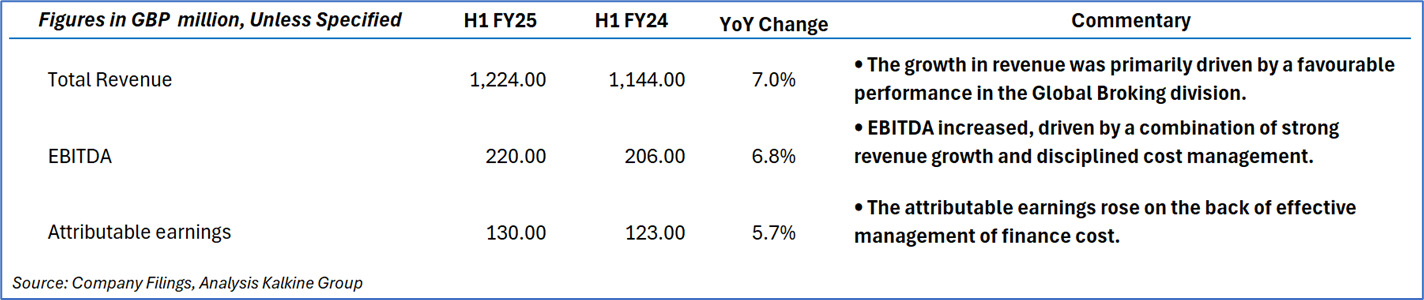
Section 2: Business Updates and Financial Highlights

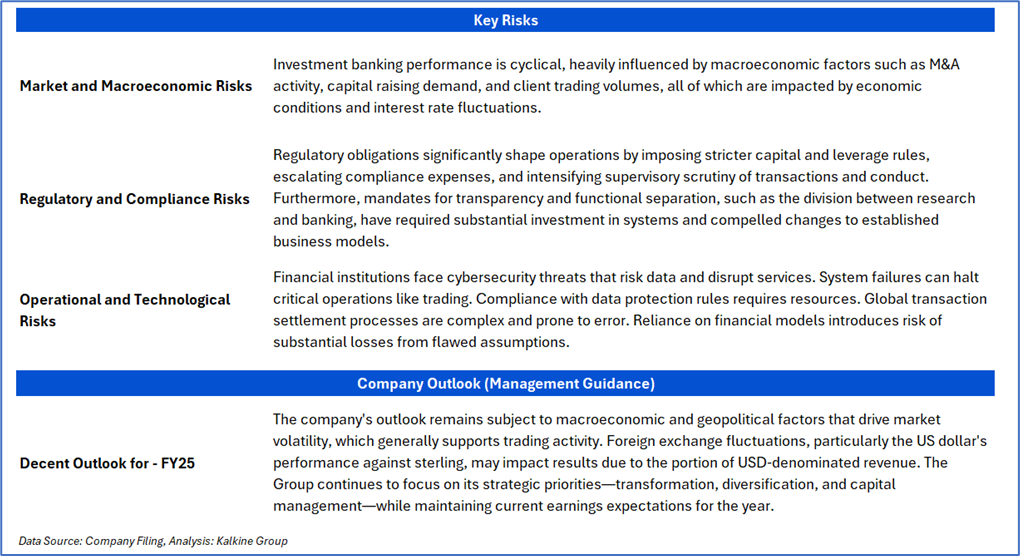
Section 3: Key Risks and Company Outlook
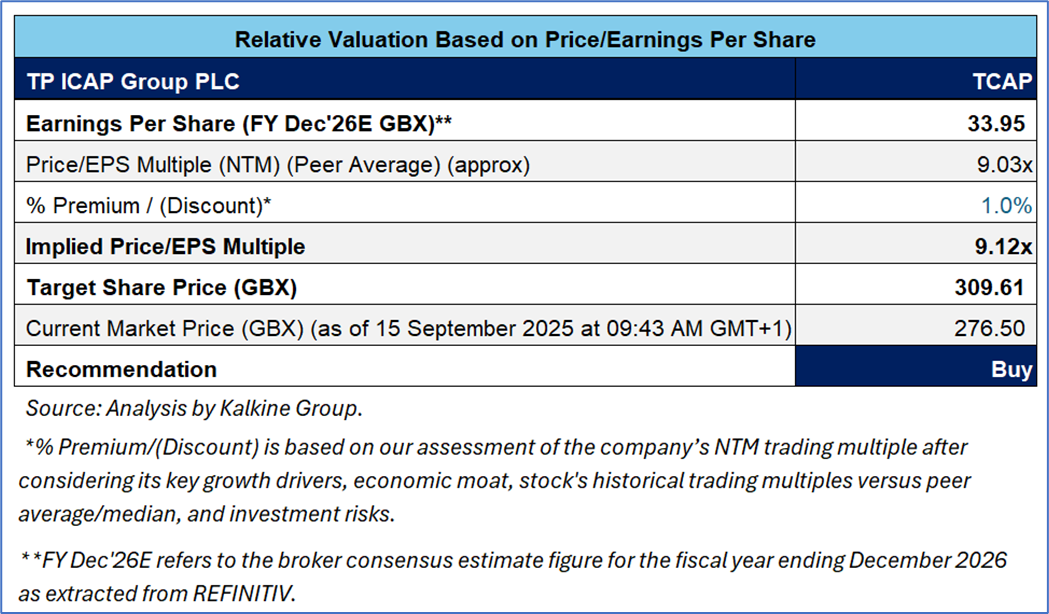
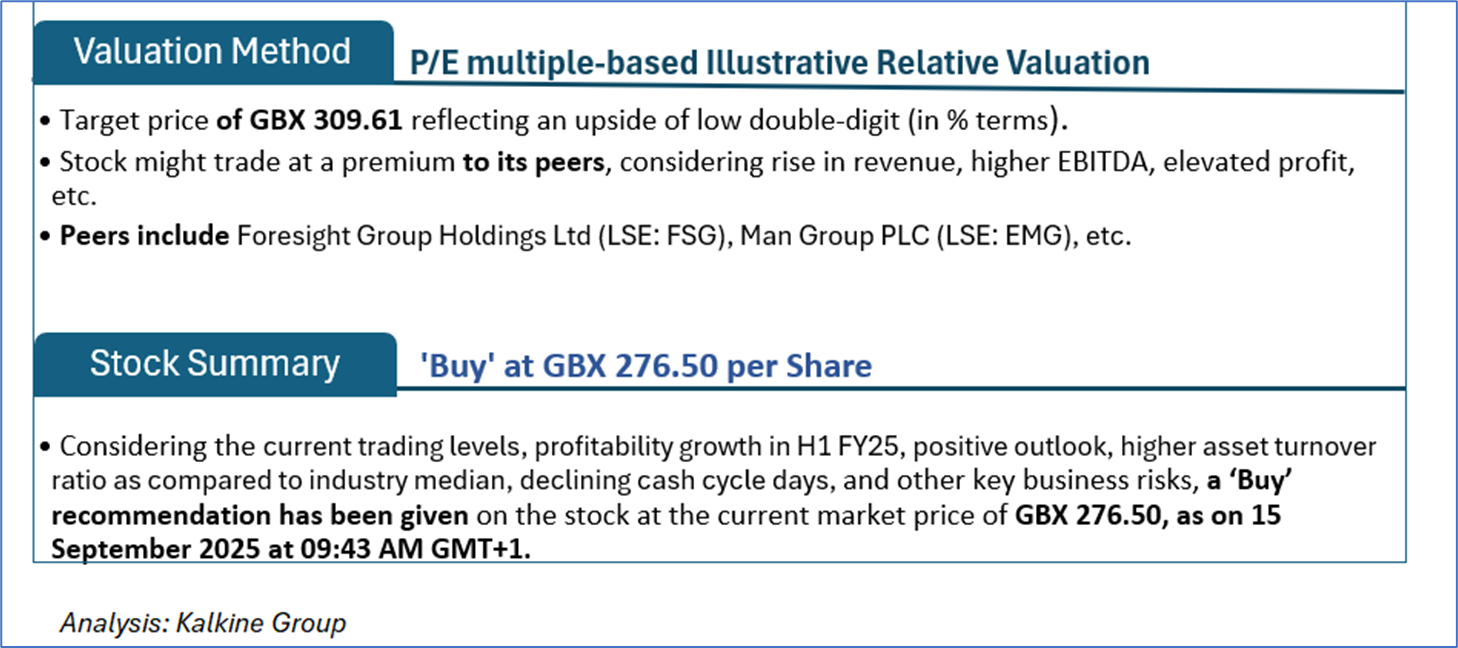
Section 4: Stock Recommendation Summary

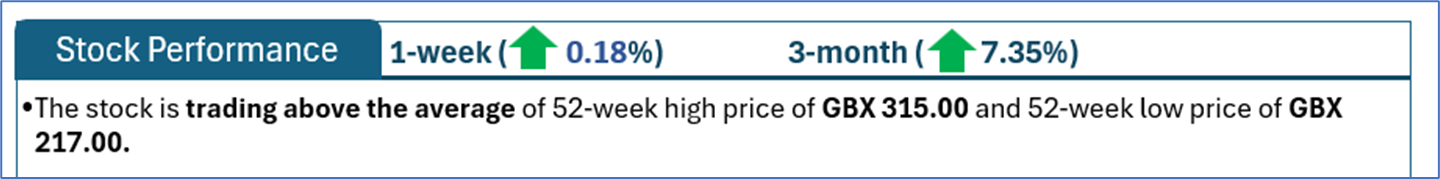
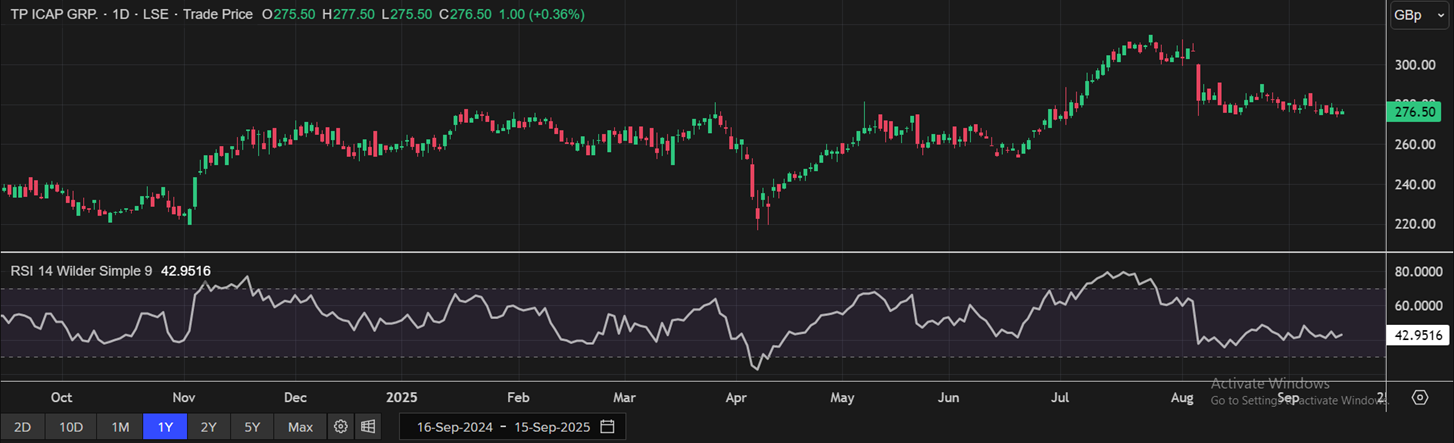
One Year Technical Price Chart (as of September 15, 2025). Source: REFINITIV, Analysis: Kalkine Group

Markets are trading in a highly volatile zone currently due to certain macroeconomic issues and geopolitical tensions prevailing. Therefore, it is prudent to follow a cautious approach while investing.
Note 1: Past performance is not a reliable indicator of future performance.
Note 2: The reference date for all price data, currency, technical indicators, support, and resistance level is 15 September 2025. The reference data in this report has been partly sourced from REFINITIV.
Note 3: Investment decisions should be made depending on an individual's appetite for upside potential, risks, holding duration, and any previous holdings. An 'Exit' from the stock can be considered if the Target Price mentioned as per the Valuation and or the technical levels provided have been achieved and is subject to the factors discussed above.
Note 4: Target Price refers to a price level which the stock is expected to reach as per the relative valuation method and technical analysis taking into consideration both short-term and long-term scenarios.
Note 5: ‘Kalkine reports are prepared based on the stock prices captured either from the London Stock Exchange (LSE) and REFINITIV. Typically, both sources (LSE and or REFINITIV) may reflect stock prices with a delay which could be a lag of 15-20 minutes. There can be no assurance that future results or events will be consistent with the information provided in the report. The information is subject to change without any prior notice.
Note 6: Dividend Yield may vary as per the stock price movement.
Technical Indicators Defined: -
Support: A level at which the stock prices tend to find support if they are falling, and a downtrend may take a pause backed by demand or buying interest. Support 1 refers to the nearby support level for the stock and if the price breaches the level, then Support 2 may act as the crucial support level for the stock.
Resistance: A level at which the stock prices tend to find resistance when they are rising, and an uptrend may take a pause due to profit booking or selling interest. Resistance 1 refers to the nearby resistance level for the stock and if the price surpasses the level, then Resistance 2 may act as the crucial resistance level for the stock.
Stop-loss: It is a level to protect further losses in case of unfavourable movement in the stock prices.
Kalkine Equities LLC, with Delaware File Number 4697384, Foreign Qualification Registration in California File Number 202109211078, and Texas File Number 805521396, is authorized to provide general advice only. The information on https://kalkine.com/ does not take into account any of your investment objectives, financial situation or needs. You should consider the appropriateness of advice taking into account your own objectives, financial situation and needs and seek independent financial advice before making any financial decisions. The link to our Terms and Conditions and Privacy Policy has been provided for your reference. On the date of publishing the reports (mentioned on the website), employees and/or associates of Kalkine do not hold positions in any of the stocks covered on the website. These stocks can change any time and readers of the reports should not consider these stocks as advice or recommendations later.
Past performance is not a reliable indicator of future performance.
 Please wait processing your request...