
Section 1: Kalkine’s Rank on Select Growth Stocks
Kalkine’s growth stocks ranking report aims to provide a wide range of stocks ranked from low to high illustrating high growth potential across small-cap mid-cap, and large-cap space alongside other fundamental metrics defined below.
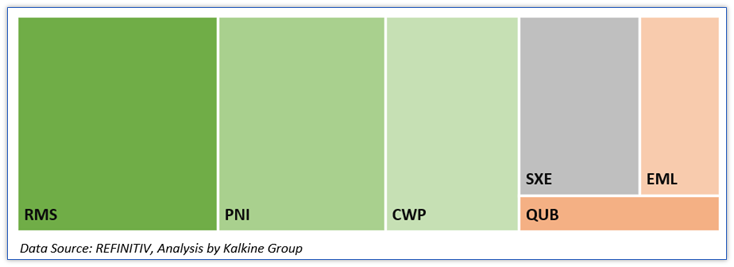
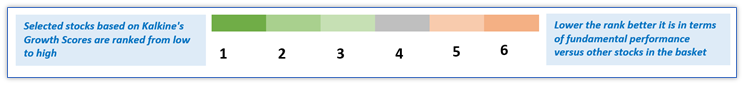
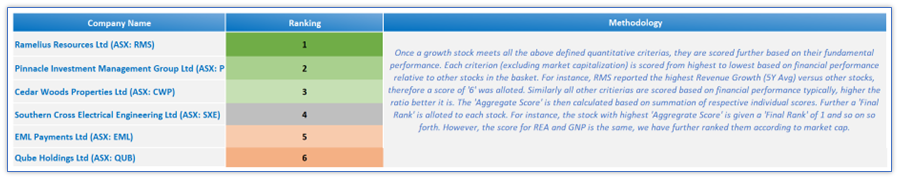
Note: Selected growth stocks are ranked from low to high using Kalkine’s unique ranking methodology, where-in low rank implies better fundamental metrics performance versus other stocks in the basket. Refer to Section 5 for more details on metrics used in ranking the growth stocks from low to high.
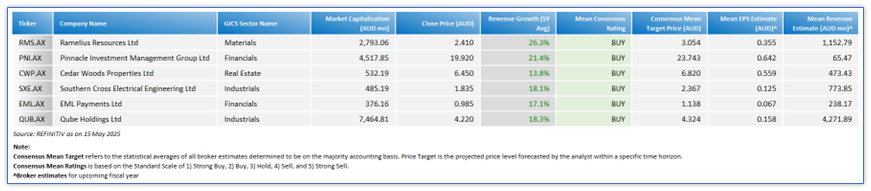
Section 2: Stock Price Performance, Key Financial and Technical Highlights
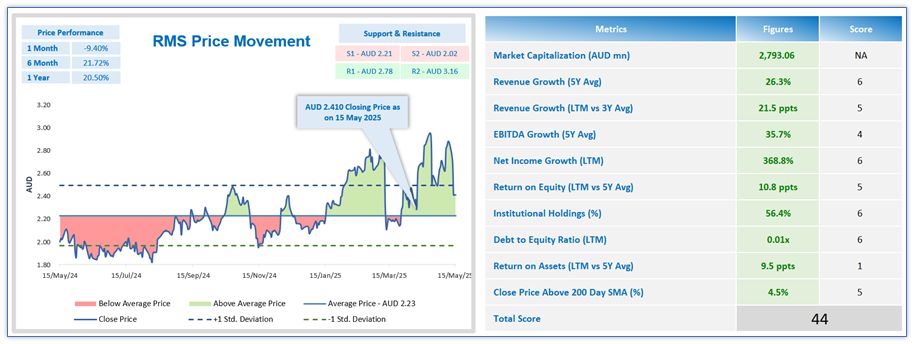
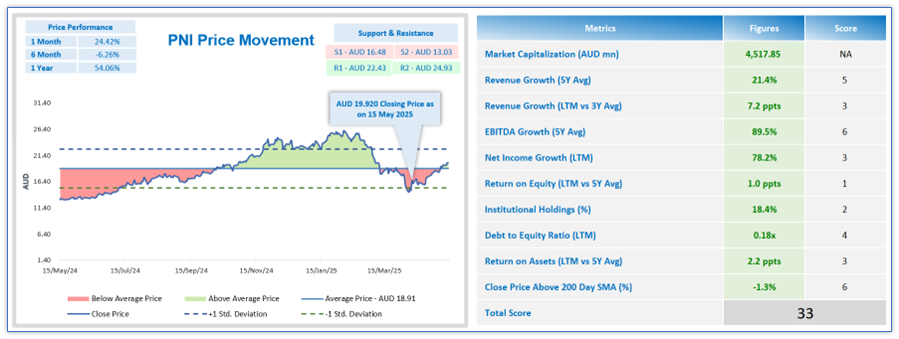
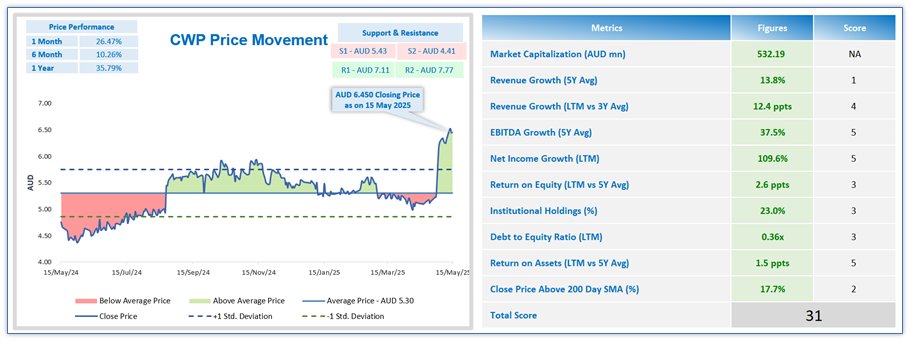
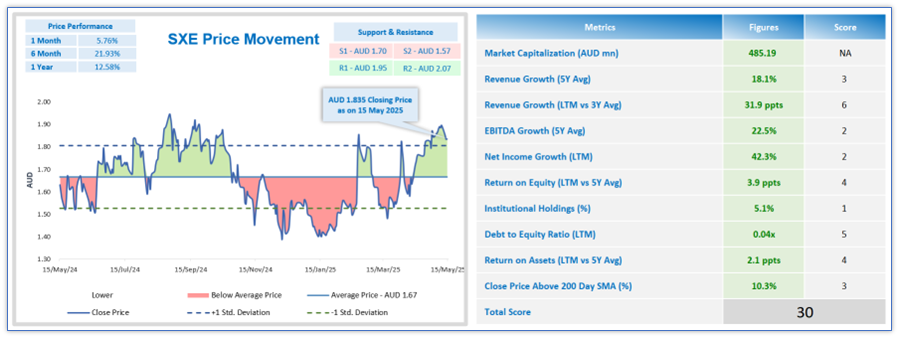
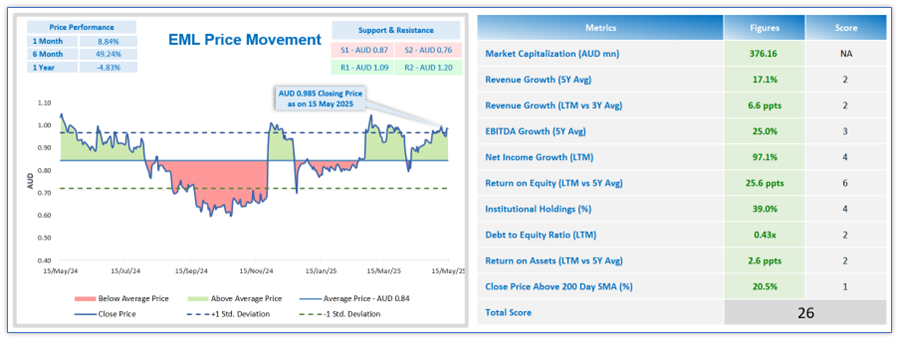
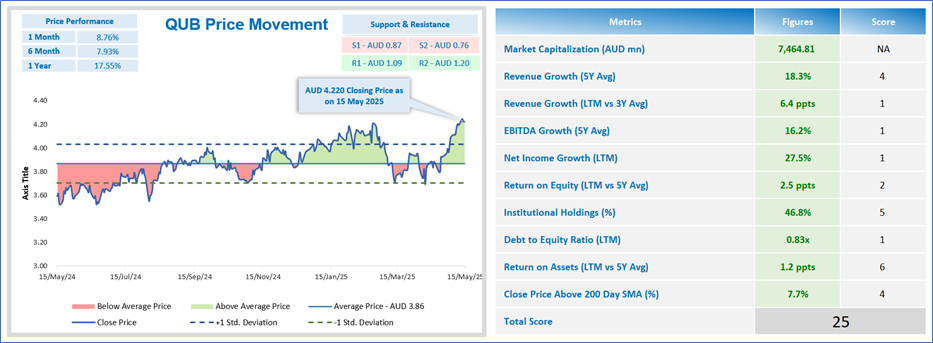
Data Source: REFINITIV; Analysis by Kalkine Group
Note: 3Y Avg = 3 Years Average; 5Y Avg = 5 Years Average; EBITDA refers to Earnings Before Interest, Tax, Depreciation & Amortization, LTM refers to the last twelve months
Section 3: Key Broker Consensus Data on Growth Stocks
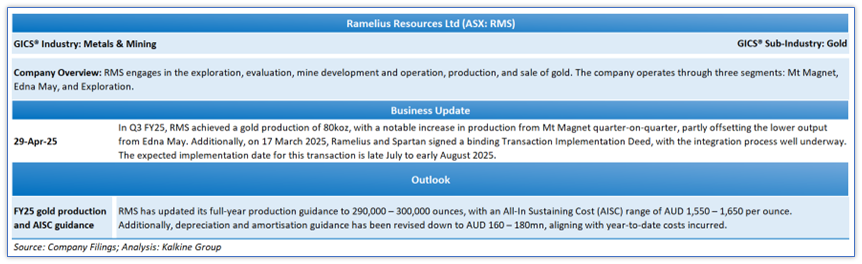
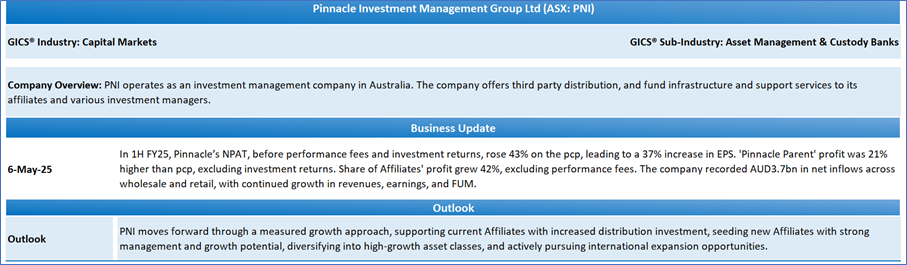
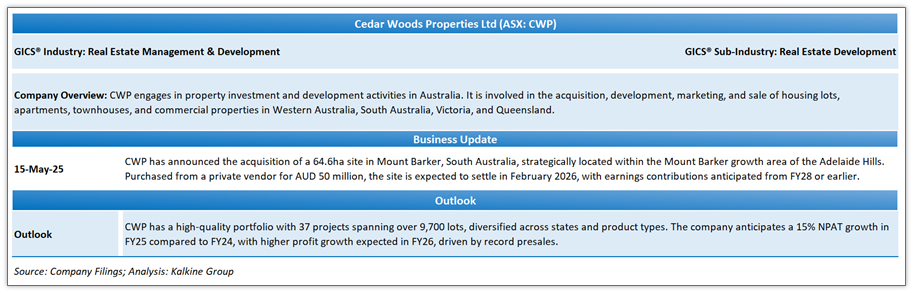
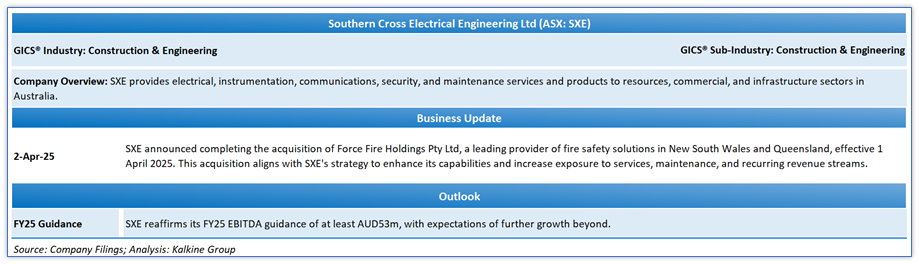
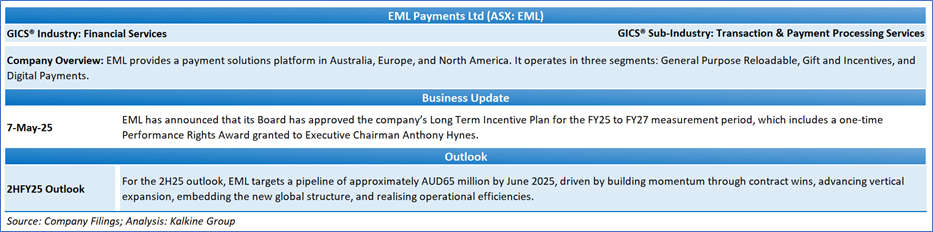
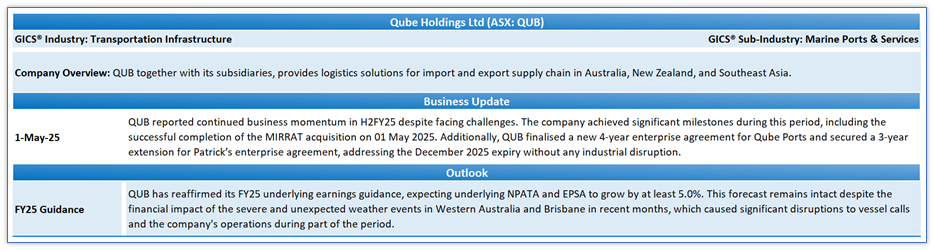
Section 4: Recent Business Updates and Outlook of Growth Stocks
Section 5: Kalkine’s Unique Growth Stocks Ranking Method
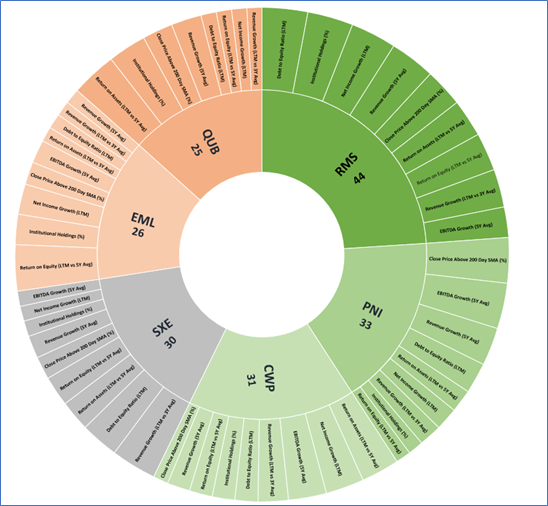
ASX-listed growth stocks are scored based on the below set of quantitative fundamental criteria’s as per Kalkine’s unique scoring methodology. The objective is to screen the growth companies with a track record of revenue and EBITDA growth for 5 or more years. Only stocks that scored highest and met the selection criterias based on all of the above quantitative fundamental metrics were further scored. The scoring was done among all the screened stocks based on their fundamental performance relative to the stock basket selected.
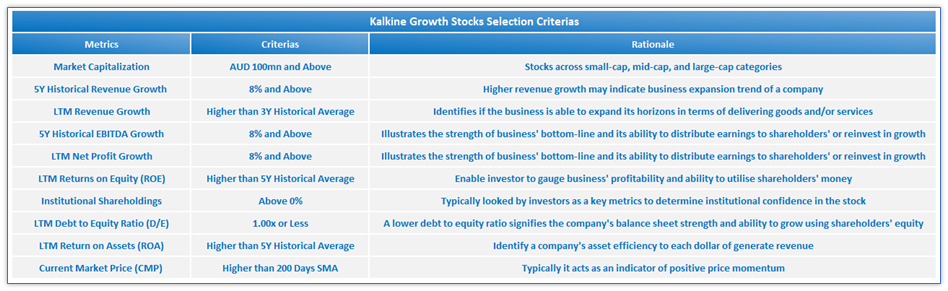
As a next step, the stocks are ranked from low to high, where-in lower the rank, the better it is, considering the better financial performance versus other stocks identified.
Kalkine’s Growth Score-Break Up
Source: Kalkine Group; Copyright © 2025 Krish Capital Pty. Ltd.
Note 1: Past performance is not a reliable indicator of future performance.
Note 2: The reference date for all price data, currency, technical indicators, support, and resistance levels is 15 May 2025. The reference data in this report has been partly sourced from REFINITIV.
Technical Indicators Defined: -
Support: A level at which the stock prices tend to find support if they are falling, and a downtrend may take a pause backed by demand or buying interest. Support 1 refers to the nearby support level for the stock and if the price breaches the level, then Support 2 may act as the crucial support level for the stock.
Resistance: A level at which the stock prices tend to find resistance when they are rising, and an uptrend may take a pause due to profit booking or selling interest. Resistance 1 refers to the nearby resistance level for the stock and if the price surpasses the level, then Resistance 2 may act as the crucial resistance level for the stock.
Kalkine Equities LLC, with Delaware File Number 4697384, Foreign Qualification Registration in California File Number 202109211078, and Texas File Number 805521396, is authorized to provide general advice only. The information on https://kalkine.com/ does not take into account any of your investment objectives, financial situation or needs. You should consider the appropriateness of advice taking into account your own objectives, financial situation and needs and seek independent financial advice before making any financial decisions. The link to our Terms and Conditions and Privacy Policy has been provided for your reference. On the date of publishing the reports (mentioned on the website), employees and/or associates of Kalkine do not hold positions in any of the stocks covered on the website. These stocks can change any time and readers of the reports should not consider these stocks as advice or recommendations later.
Past performance is not a reliable indicator of future performance.
 Please wait processing your request...