
Section 1: Company Overview and Fundamentals
1.1 Company Overview:
The AES Corporation (NYSE: AES) is the power generation and utility company. It operates through 4 segments: Renewables, Utilities, Energy Infrastructure, and New Energy Technologies.
Kalkine’s Global Big Money Report covers the Key Financial Metrics, Risks, Outlook, Technical Analysis along with the Valuation, Target Price, and Recommendation on the stock.
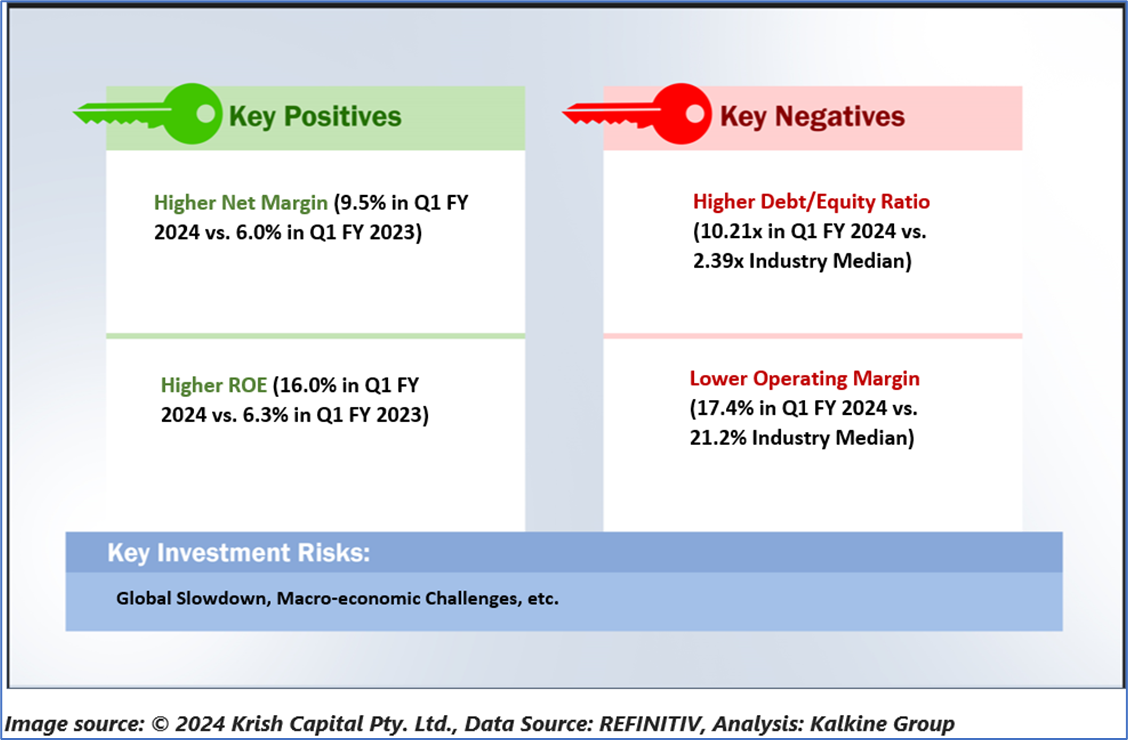
1.2 The Key Positives, Negatives, Investment Highlights and Risks
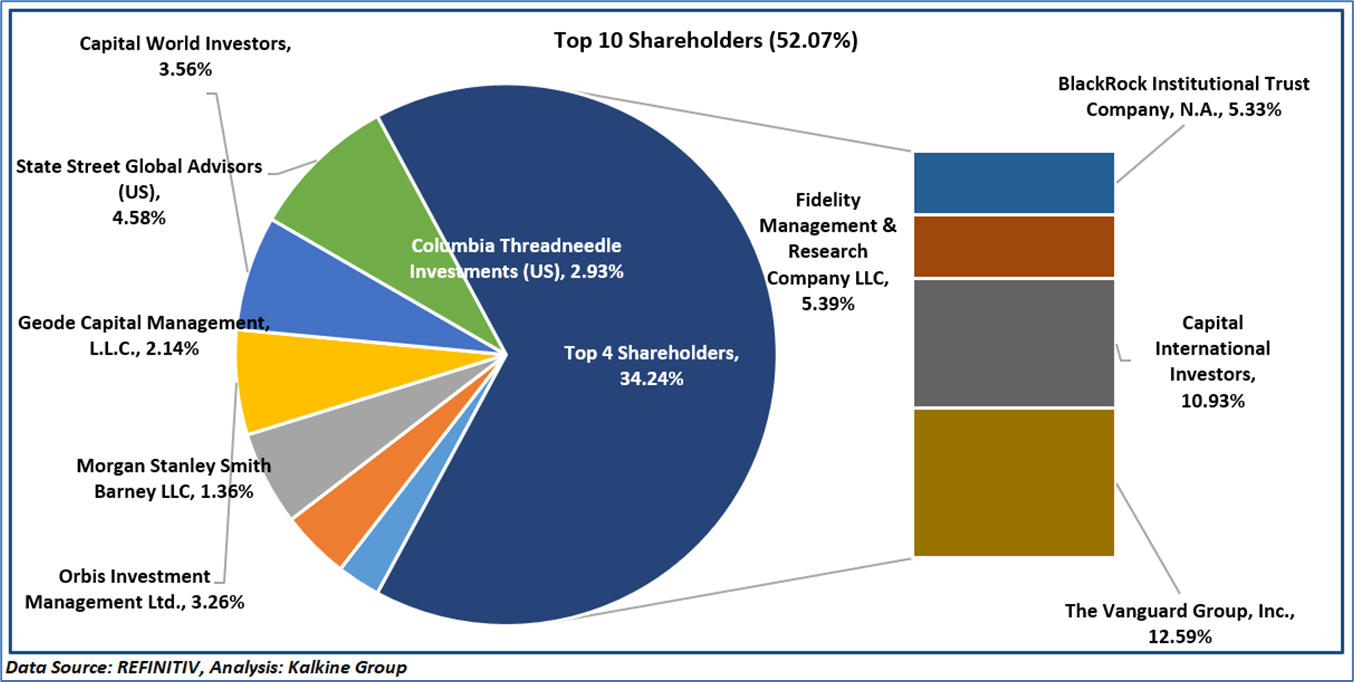
1.3 Top 10 Shareholders: The top 10 shareholders have been highlighted in the chart below, which together form ~52.07% of the total shareholding.
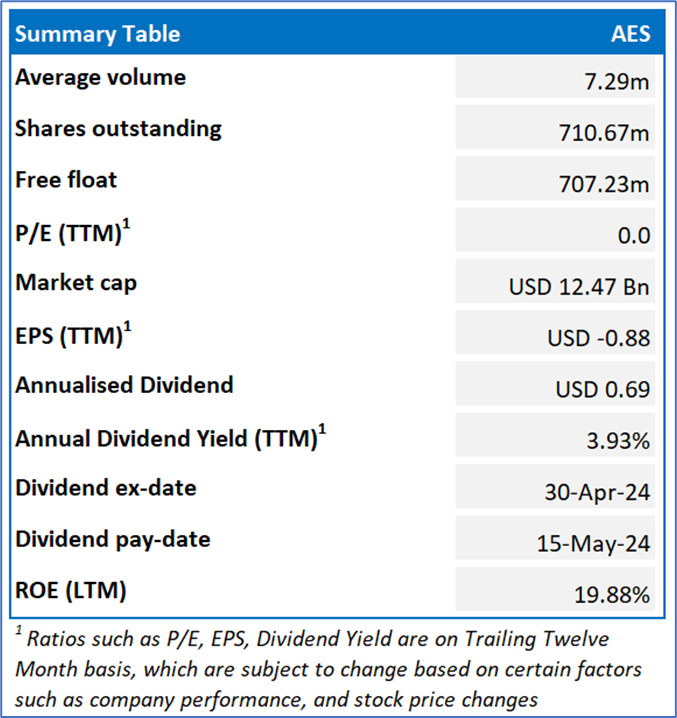
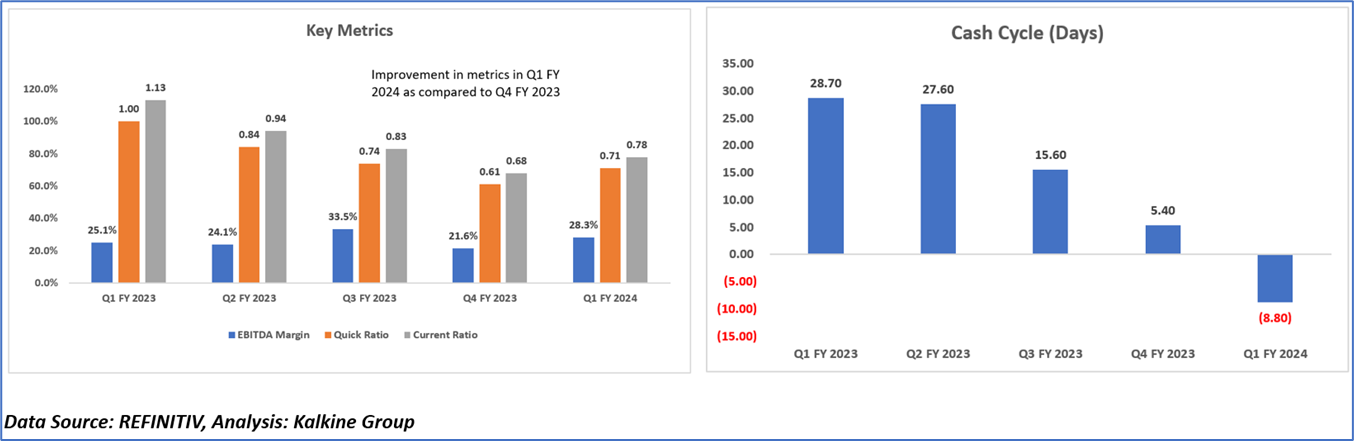
1.4 Key Metrics:
Below mentioned are some of the key metrics of AES:
Section 2: Financial Highlights
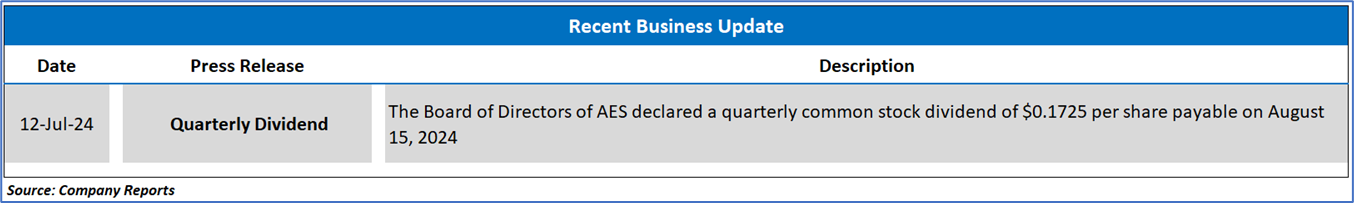
2.1 Recent Update
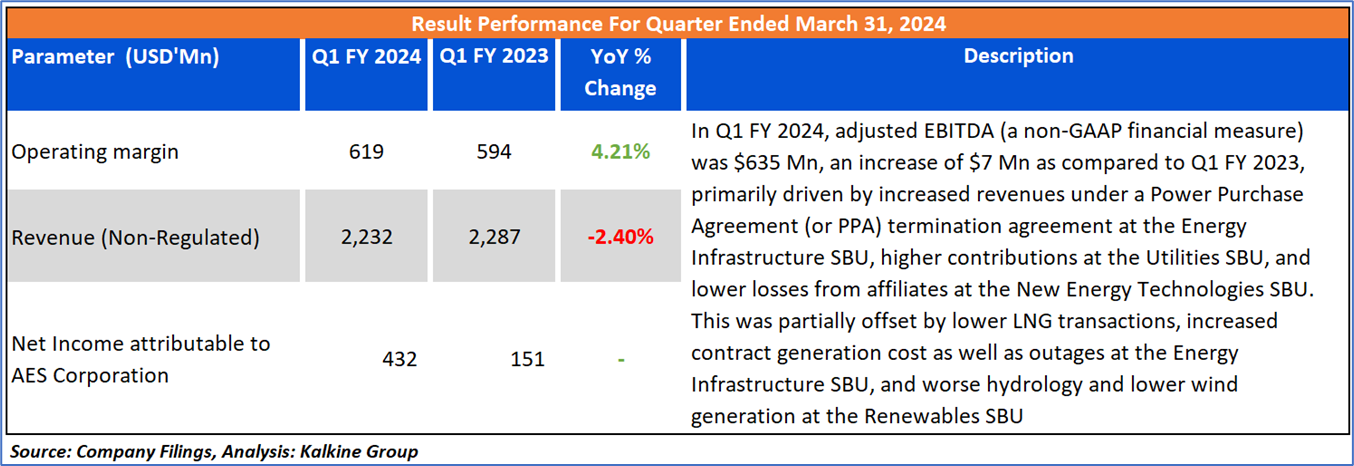
2.2 Insights of Q1 FY 2024:
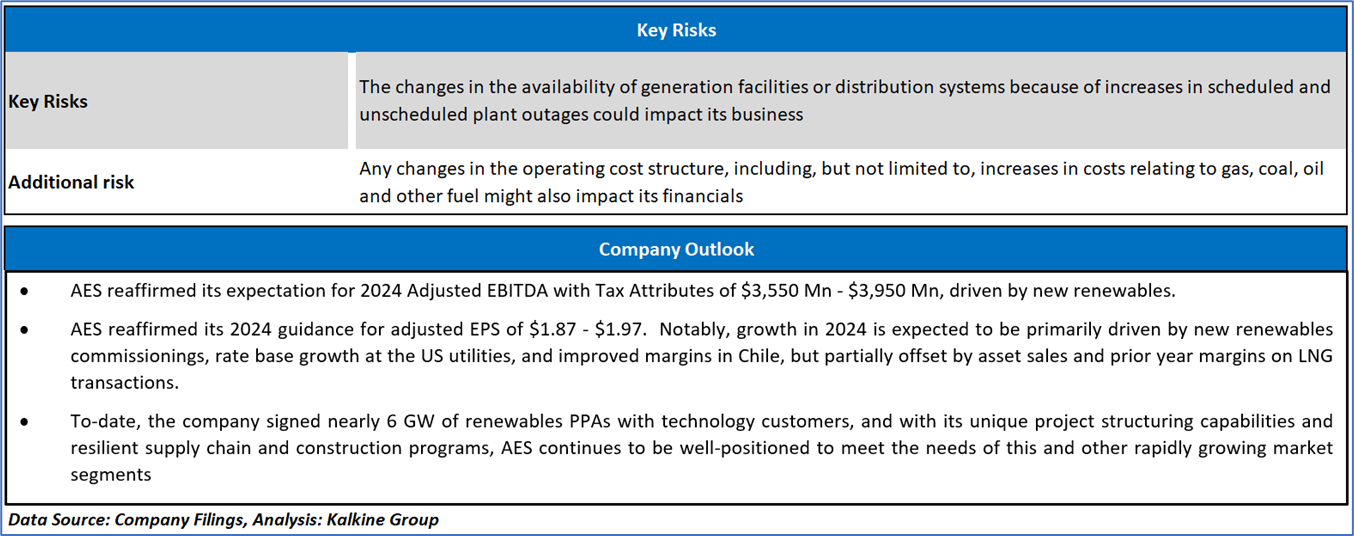
Section 3: Key Risks and Outlook:
Section 4: Stock Recommendation Summary:
4.1 Price Performance and Technical Summary:
The stock has witnessed a rise of ~2.51% in 3 months and over the last 6 months, it has increased by ~4.46%. The stock has a 52-week high and 52-week low of USD 22.6 and USD 11.43, respectively.
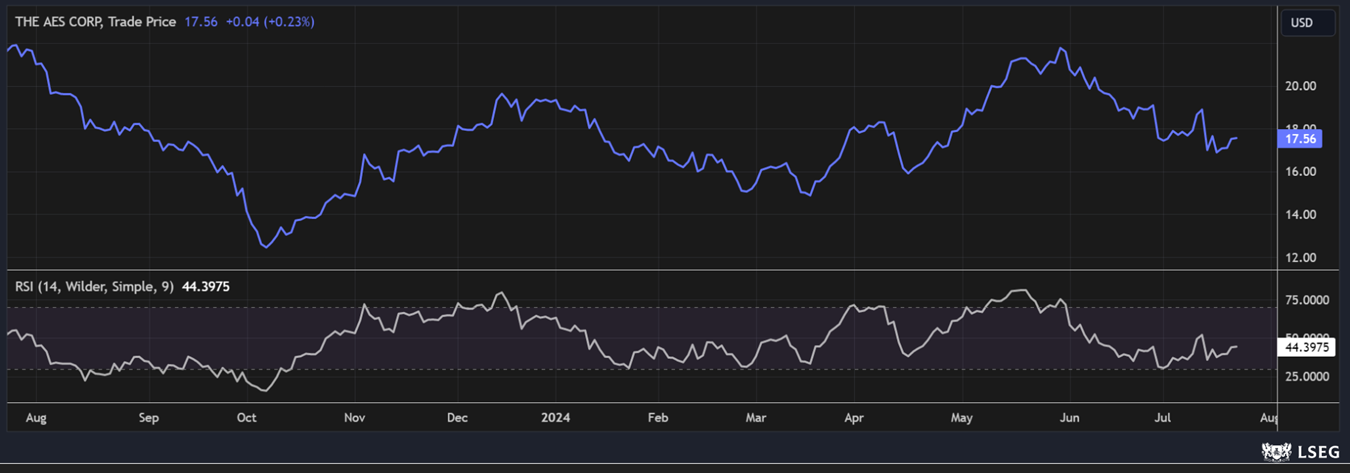
AES Daily Technical Chart, Data Source: REFINITIV
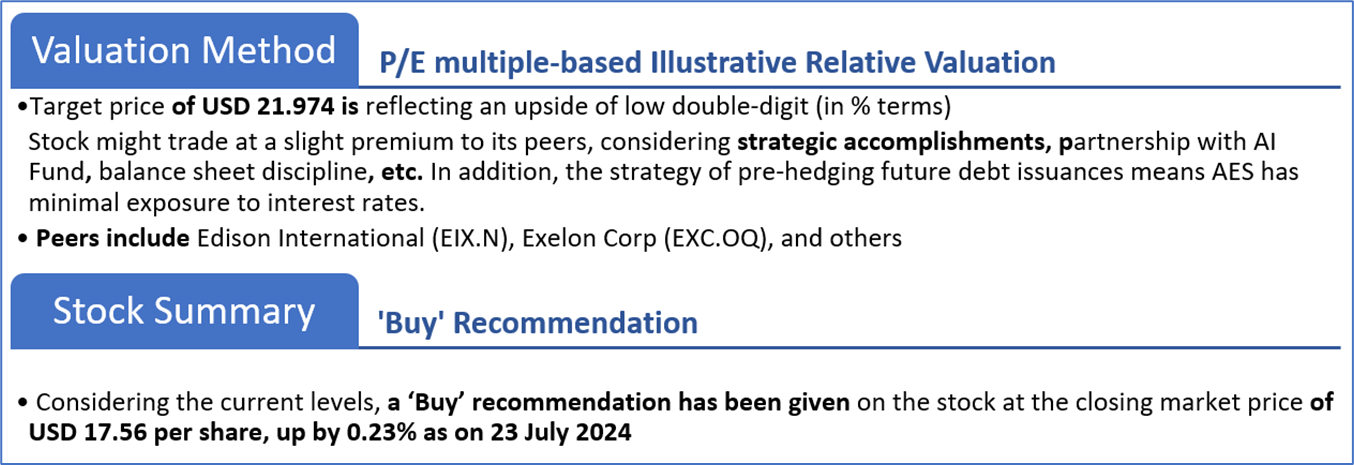
4.2 Fundamental Valuation
Valuation Methodology: Price/EPS Multiple Based Relative Valuation (Illustrative)

Markets are trading in a highly volatile zone currently due to certain macro-economic issues and geopolitical tensions prevailing. Therefore, it is prudent to follow a cautious approach while investing.
Note 1: Past performance is neither an indicator nor a guarantee of future performance.
Note 2: The reference date for all price data, currency, technical indicators, support, and resistance levels is July 23, 2024. The reference data in this report has been partly sourced from REFINITIV.
Note 3: Investment decisions should be made depending on an individual's appetite for upside potential, risks, holding duration, and any previous holdings. An 'Exit' from the stock can be considered if the Target Price mentioned as per the Valuation and or the technical levels provided has been achieved and is subject to the factors discussed above.
Technical Indicators Defined: -
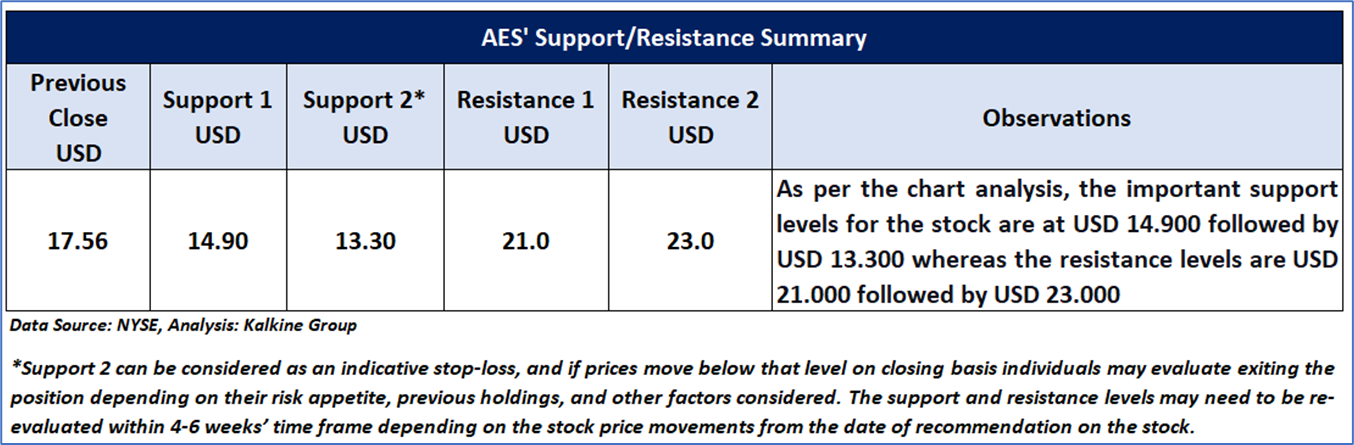
Support: A level at which the stock prices tend to find support if they are falling, and a downtrend may take a pause backed by demand or buying interest. Support 1 refers to the nearby support level for the stock and if the price breaches the level, then Support 2 may act as the crucial support level for the stock.
Resistance: A level at which the stock prices tend to find resistance when they are rising, and an uptrend may take a pause due to profit booking or selling interest. Resistance 1 refers to the nearby resistance level for the stock and if the price surpasses the level, then Resistance 2 may act as the crucial resistance level for the stock.
Stop-loss: It is a level to protect further losses in case of unfavourable movement in the stock prices.
Kalkine Equities LLC, with Delaware File Number 4697384, Foreign Qualification Registration in California File Number 202109211078, and Texas File Number 805521396, is authorized to provide general advice only. The information on https://kalkine.com/ does not take into account any of your investment objectives, financial situation or needs. You should consider the appropriateness of advice taking into account your own objectives, financial situation and needs and seek independent financial advice before making any financial decisions. The link to our Terms and Conditions and Privacy Policy has been provided for your reference. On the date of publishing the reports (mentioned on the website), employees and/or associates of Kalkine do not hold positions in any of the stocks covered on the website. These stocks can change any time and readers of the reports should not consider these stocks as advice or recommendations later.
Copyright © 2024 Krish Capital Pty Ltd. All rights reserved.
 US
US  AU
AU UK
UK CA
CA NZ
NZ Please wait processing your request...