Section 1: Company Fundamentals
1.1 Company Overview and Performance summary
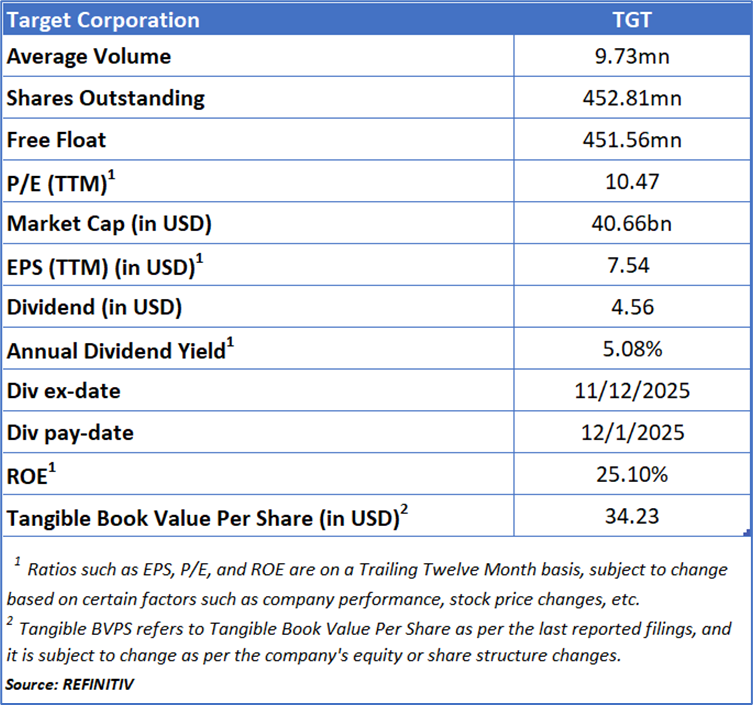
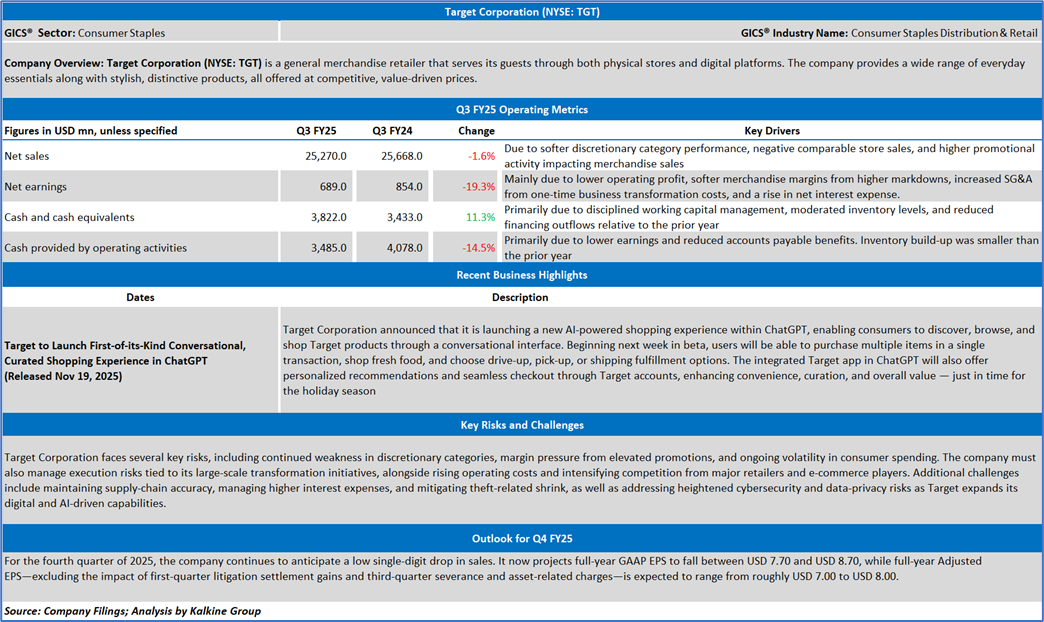
Company Overview:
Target Corporation (NYSE: TGT) is a general merchandise retailer that serves its guests through both physical stores and digital platforms. The company provides a wide range of everyday essentials along with stylish, distinctive products, all offered at competitive, value-driven prices.
This US Inflation Report covers the Company Overview & Price performance, Summary table, Key positives & negatives, Key metrics, Company details, technical guidance & Stock recommendation, and Price chart.
Price Performance:
1.2 Summary Table
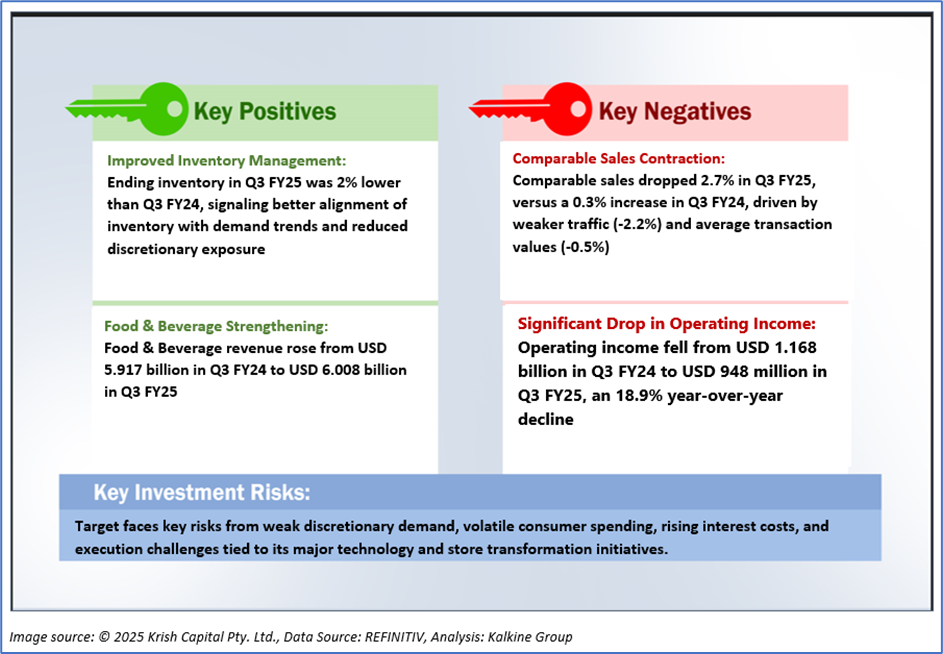
1.3 The Key Positives & Negatives
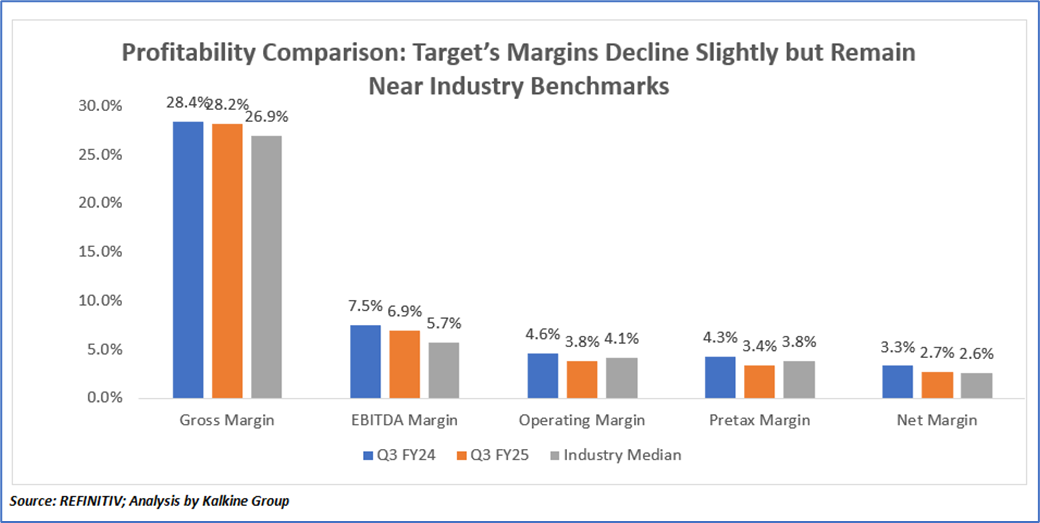
1.4 Key Metrics
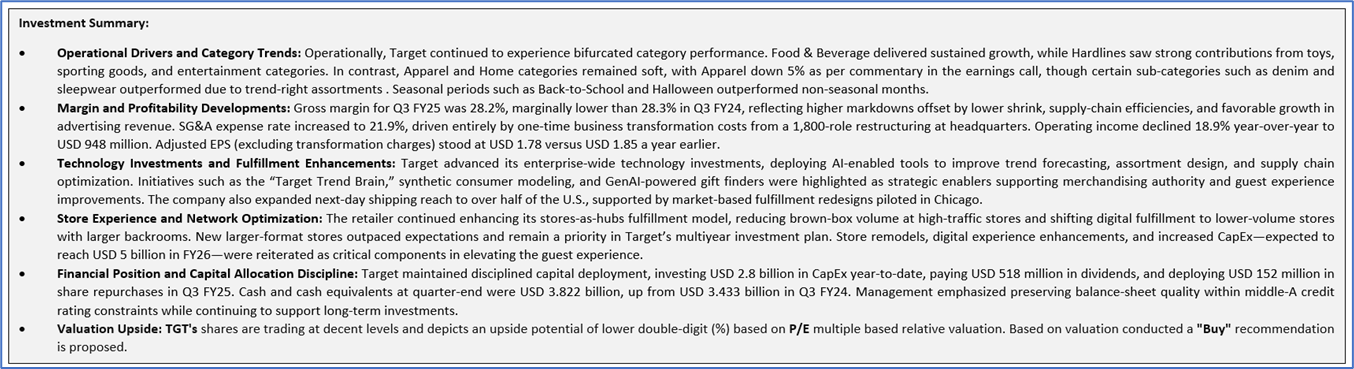
Target’s margin trends between Q3 FY24 and Q3 FY25 reflect the combined impact of softer discretionary sales, increased promotional activity, and strategic investments, partially offset by efficiency gains and growth in higher-margin revenue streams. The slight decline in gross margin (from 28.4% to 28.2%) is primarily due to higher markdowns taken to stimulate demand in weak discretionary categories, despite meaningful improvement in inventory shrink and supply-chain efficiencies. The EBITDA and operating margin compression (7.5% to 6.9% and 4.6% to 3.8%, respectively) stems from lower sales leverage, continued softness in traffic, and one-time business transformation costs related to the 1,800-role restructuring at headquarters. Pretax and net margin declines are further affected by a rise in interest expense from higher average debt levels. Although Target’s margin performance remains above or close to industry medians, profitability remains pressured by a challenging consumer environment, discretionary category weakness, and strategic investments aimed at strengthening merchandising, technology, and store experience capabilities.
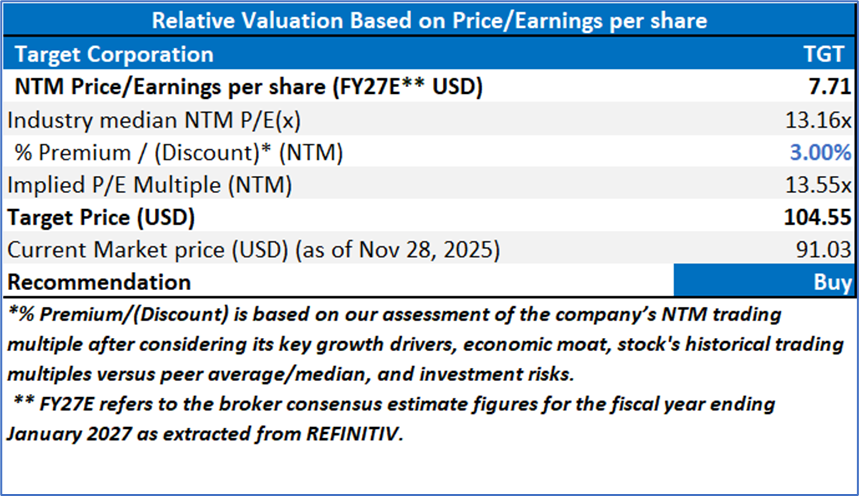
Section 2: Target Corporation (NYSE: TGT) (“Buy” at the current market price of USD 91.03, as of Nov 28,2025 at 8:20 am PST)
2.1 Company Details
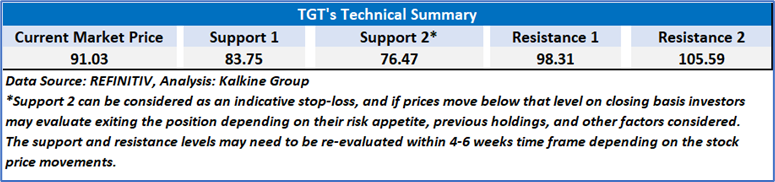
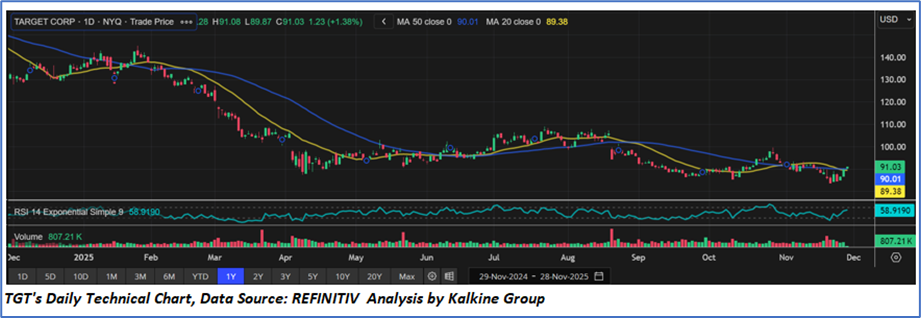
2.2 Technical Guidance and Stock Recommendation
Markets are trading in a highly volatile zone currently due to certain macroeconomic issues and geopolitical tensions prevailing. Therefore, it is prudent to follow a cautious approach while investing.
Note 1: Past performance is not a reliable indicator of future performance.
Note 2: The reference date for all price data, currency, technical indicators, support, and resistance levels is Nov 28, 2025. The reference data in this report has been partly sourced from REFINITIV.
Note 3: Investment decisions should be made depending on an individual's appetite for upside potential, risks, holding duration, and any previous holdings. An 'Exit' from the stock can be considered if the Target Price mentioned as per the Valuation and or the technical levels provided has been achieved and is subject to the factors discussed above.
Note 4: The report publishing date is as per the Pacific Time Zone.
Technical Indicators Defined: -
Support: A level at which the stock prices tend to find support if they are falling, and a downtrend may take a pause backed by demand or buying interest. Support 1 refers to the nearby support level for the stock and if the price breaches the level, then Support 2 may act as the crucial support level for the stock.
Resistance: A level at which the stocks prices tend to find resistance when they are rising, and an uptrend may take a pause due to profit booking or selling interest. Resistance 1 refers to the nearby resistance level for the stock and if the price surpasses the level, then Resistance 2 may act as the crucial resistance level for the stock.
Stop-loss: It is a level to protect against further losses in case of unfavorable movement in the stock prices.
Kalkine Equities LLC, with Delaware File Number 4697384, Foreign Qualification Registration in California File Number 202109211078, and Texas File Number 805521396, is authorized to provide general advice only. The information on https://kalkine.com/ does not take into account any of your investment objectives, financial situation or needs. You should consider the appropriateness of advice taking into account your own objectives, financial situation and needs and seek independent financial advice before making any financial decisions. The link to our Terms and Conditions and Privacy Policy has been provided for your reference. On the date of publishing the reports (mentioned on the website), employees and/or associates of Kalkine do not hold positions in any of the stocks covered on the website. These stocks can change any time and readers of the reports should not consider these stocks as advice or recommendations later.
Past performance is not a reliable indicator of future performance.
 Please wait processing your request...