Company Overview: Target Corporation (NYSE: TGT) is a general merchandise retailer selling products to its guests through its stores and digital channels. The Company offers customers, referred to as guests, everyday essentials and fashionable, differentiated merchandise at discounted prices. Most of its stores offer a wide assortment of general merchandise and food. Its merchandise categories include apparel and accessories, beauty and household essentials, food and beverage, hardlines, and home furnishings and decor.
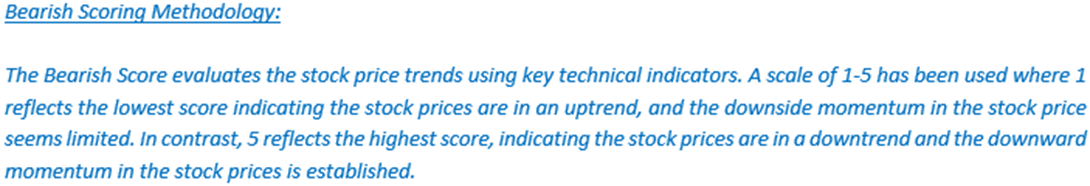
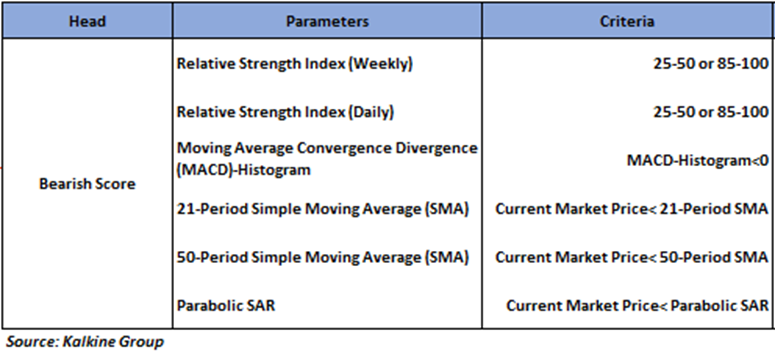
This Report covers the Price Action, Technical Indicators Analysis along with the Support Levels, Resistance Level, and Trend Indication on this one stock. Noted below is the illustrative bearish score based on technical indicators for the stock:
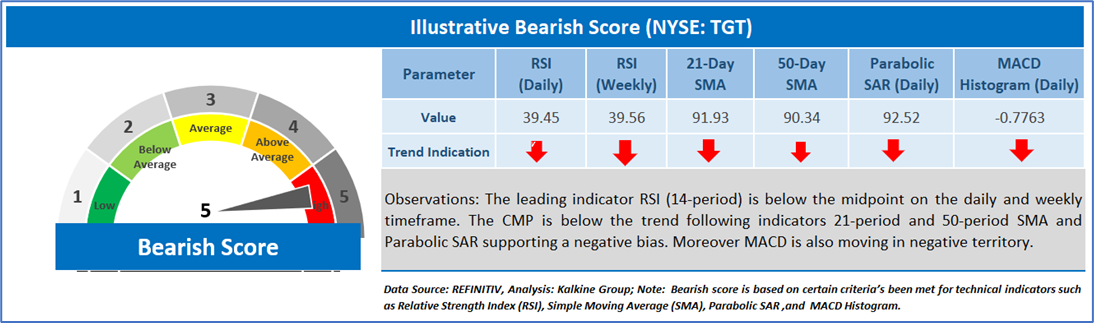

Technical Observation (on the daily chart)
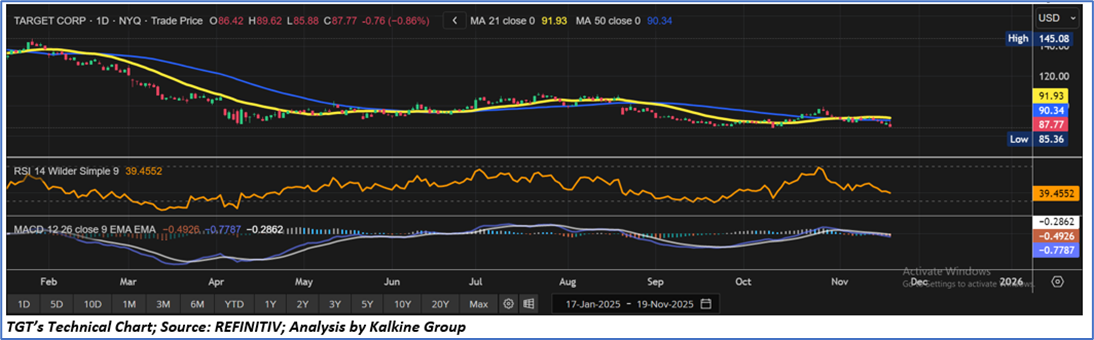
Target Corp. (TGT) is exhibiting a mildly bearish technical setup as the stock trades near USD 87.77 and remains below both the 21-day and 50-day moving averages, signalling weakening short-term momentum and a lack of sustained buying interest. The RSI hovering near 39 reflects subdued sentiment and places the stock close to oversold territory, indicating persistent selling pressure without signs of a momentum recovery. Further, the MACD line is slipping below the signal line in negative territory, reinforcing a deteriorating trend and suggesting limited bullish conviction. With resistance building around USD 90–92 and weak volume participation, downside risk remains toward the recent low near USD 85.36, unless the stock can reclaim key moving averages to stabilise the trend.
Conclusion
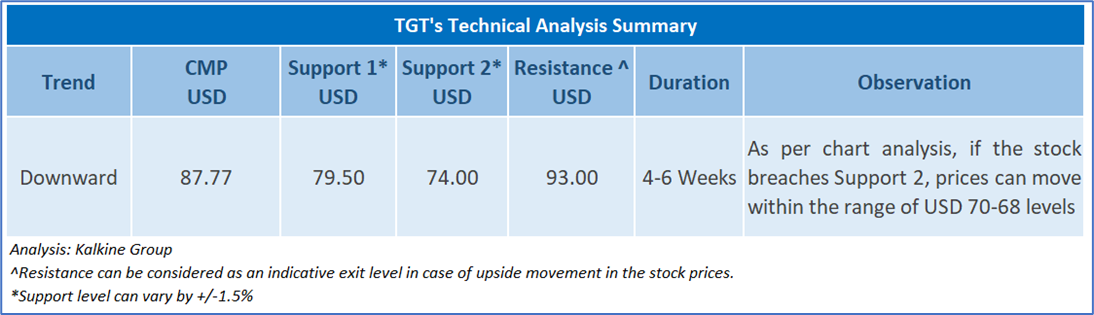
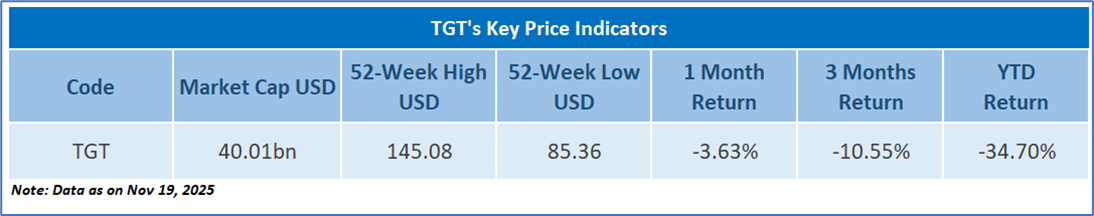
Based on the above-mentioned price action and technical indicators analysis, Target Corporation (NYSE: TGT) may witness a downside movement in the near future. The trend looks to be in an interesting space, and the stock looks ‘Bearish’ at the current market price of USD 87.77 as on November 19, 2025 (09:30 am PST).
Markets are trading in a highly volatile zone currently due to certain macro-economic issues and prevailing geopolitical tensions. Therefore, it is prudent to follow a cautious approach while making investment decisions.
Note 1: Past performance is not a reliable indicator of future performance.
Note 2: Investment decisions should be made depending on an individual’s appetite for upside potential, risks, and any previous holdings. This report is purely based on technical analysis, and fundamental analysis has not been considered in this report.
Note 3: Related Risks: This report may be looked at from a high-risk perspective, and directions are provided for a short duration. The analysis provided in this report is solely based on technical parameters, and the fundamental performance of the stocks has not been considered in the decision-making process. Other factors which could impact on stock prices include market risks, regulatory risks, interest rates risks, currency risks, social and political instability risks etc.
Note 4: How to Read the Charts?
The Green color line reflects the 21-period moving average, while the red color line indicates the 50-period moving average. SMA helps to identify existing price trend. If the prices are trading above the 21-period and 50-period moving average, then it shows prices are currently trading in a bullish trend.
The Black color line in the chart's lower segment reflects the Relative Strength Index (14-Period), which indicates price momentum and signals momentum in trend. A reading of 70 or above suggests overbought status, while a reading of 30 or below suggests an oversold status.
The Blue color bars in the chart's lower segment show the volume of the stock. The volume is the number of shares that changed hands during a given day. Stocks with high volumes are more liquid than stocks with lesser volume. Liquidity in stocks helps in easier and faster execution of the order.
The Orange color lines are the trend lines drawn by connecting two or more price points and used for trend identification purposes. The trend line also acts as a line of support and resistance.
Technical Indicators Defined: -
Support: A level at which the stock prices tend to find support if they are falling, and a downtrend may take a pause backed by demand or buying interest. Support 1 refers to the nearby support level for the stock and if the price breaches the level, then Support 2 may act as the crucial support level for the stock.
Resistance: A level at which the stock prices tend to find resistance when they are rising, and an uptrend may take a pause due to profit booking or selling interest.
Parabolic SAR: Parabolic SAR is a trend-following indicator that acts as a trailing stop. If the price stops rising and reverses below SAR, it indicates the start of a downtrend with SAR above the price following like a trailing stop. Similarly, if the prices stop falling and move above SAR, it indicates the start of an uptrend with SAR below the price following like a trailing stop.
MACD-Histogram: Moving Average Convergence Divergence (MACD)-Histogram is the difference between the MACD and its signal line. A positive value of the MACD-Histogram indicates a positive crossover between MACD and its signal line, whereas a negative value indicates a negative crossover.
Past performance is neither an indicator nor a guarantee of future performance.
The reference date for all price data, currency, technical indicators, support, and resistance levels is November 19, 2025. The reference data in this report has been partly sourced from REFINITIV.
Investment decisions should be made depending on an individual's appetite for upside potential, risks, holding duration, and any previous holdings. An 'Exit' from the stock can be considered if the Target Price mentioned as per the Valuation and or the technical levels provided has been achieved and is subject to the factors discussed above.
Abbreviations
CMP: Current Market Price
SMA: Simple Moving Average
USD: United States Dollar
RSI: Relative Strength Index
Note: Trading decisions require a thorough analysis by individuals. Technical reports in general chart out metrics that may be assessed by individuals before any stock evaluation. The above are illustrative analytical factors used for evaluating stocks; other parameters can be looked at along with additional risks per se. Past performance is neither an indicator nor a guarantee of future performance.
Kalkine Equities LLC, with Delaware File Number 4697384, Foreign Qualification Registration in California File Number 202109211078, and Texas File Number 805521396, is authorized to provide general advice only. The information on https://kalkine.com/ does not take into account any of your investment objectives, financial situation or needs. You should consider the appropriateness of advice taking into account your own objectives, financial situation and needs and seek independent financial advice before making any financial decisions. The link to our Terms and Conditions and Privacy Policy has been provided for your reference. On the date of publishing the reports (mentioned on the website), employees and/or associates of Kalkine do not hold positions in any of the stocks covered on the website. These stocks can change any time and readers of the reports should not consider these stocks as advice or recommendations later.
Past performance is not a reliable indicator of future performance.
 Please wait processing your request...