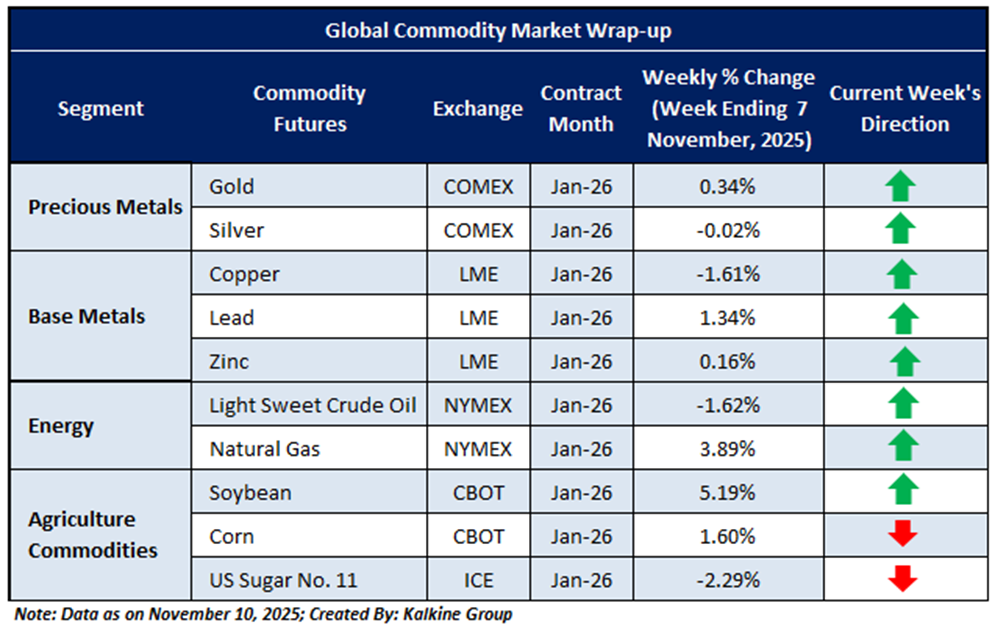
Global Commodity Market Wrap-Up
The metals market ended last week on a mixed note, weighed down by uncertainty surrounding potential interest rate cuts and easing trade tensions with China. Gold edged higher by 0.34%, while silver slipped slightly by 0.02%. Among industrial metals, copper declined 1.61%, whereas lead gained 1.34% and zinc added 0.16%. Overall, sentiment reflected cautious optimism as investors awaited key economic data and updates on the potential U.S. government shutdown.
In the energy and agricultural segments, natural gas advanced 3.89% amid ample supply conditions despite rising seasonal demand. Crude oil, however, declined 1.62%, pressured by OPEC’s production outlook and lingering trade-related uncertainties. Meanwhile, U.S. sugar fell 2.29%, and other agricultural commodities traded largely muted. The week’s overall performance underscored the continued influence of supply-demand dynamics and broader global macroeconomic factors, with upcoming economic data and potential monetary policy decisions likely to shape near-term commodity price trends.
Global commodities closed last week on a mixed note, influenced by uncertainty surrounding potential interest rate cuts and improving trade relations with China. Precious metals held near recent highs, while crude oil eased amid ongoing trade concerns and a cautious outlook on OPEC’s production levels. Natural gas retreated due to ample supply, and copper weakened as industrial demand softened. Agricultural commodities remained largely stable, supported by steady consumption patterns and favorable weather conditions. Looking ahead, market focus shifts to upcoming economic data releases and policy announcements that are likely to guide short-term commodity trends and overall investor sentiment.
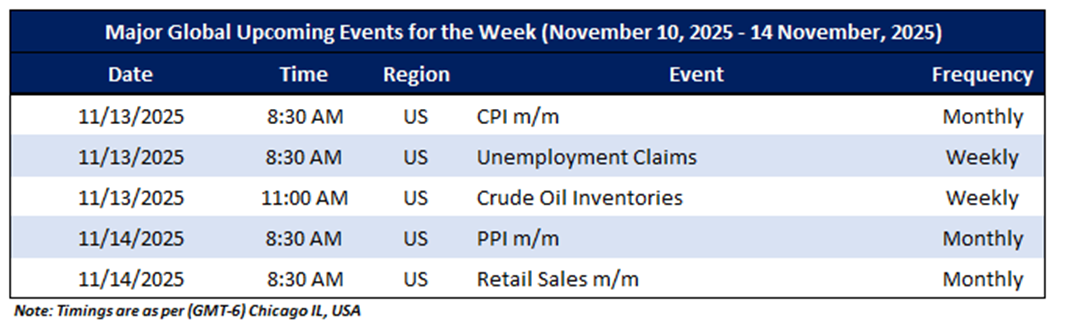
The upcoming Micro and Macroeconomic events that may impact on market sentiments include an update CPI m/m, Initial Jobless Claims, and Retail Sales m/m.
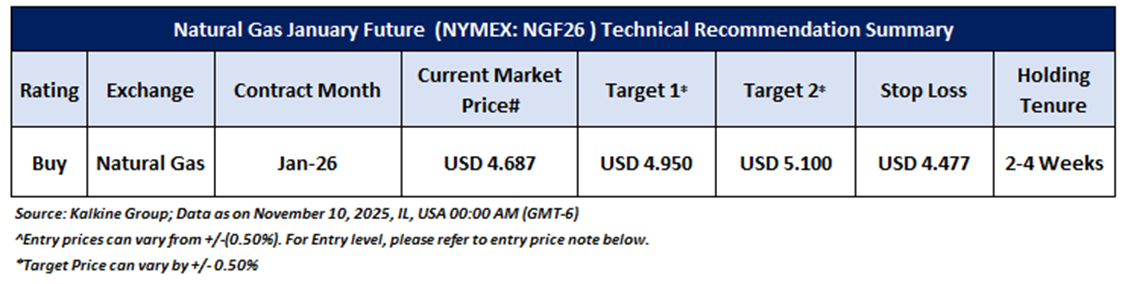
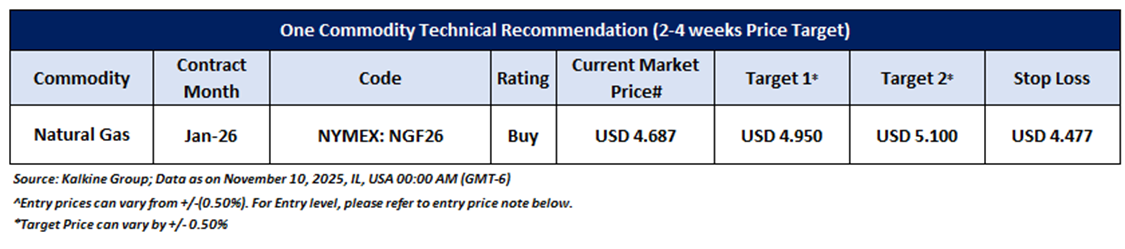
Having understood the global commodities’ performance over the past week, taking cues from major global economic events, and based on technical analysis, noted below is the recommendation with generic insights, entry price, target prices, and stop-loss Natural Gas January Future (NYMEX: NGF26) for the next 2-4-week duration:
Natural Gas January Future (NYMEX: NGF26)
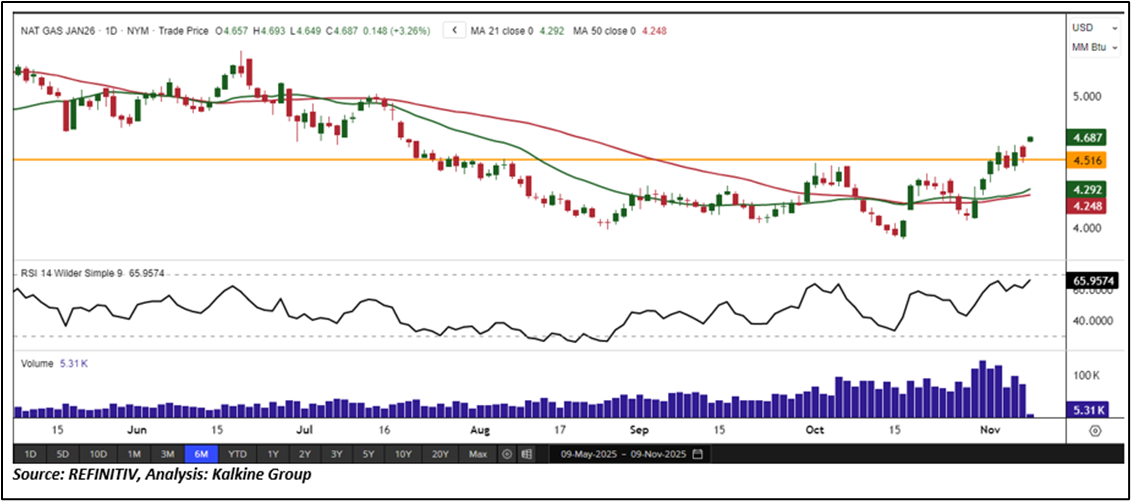
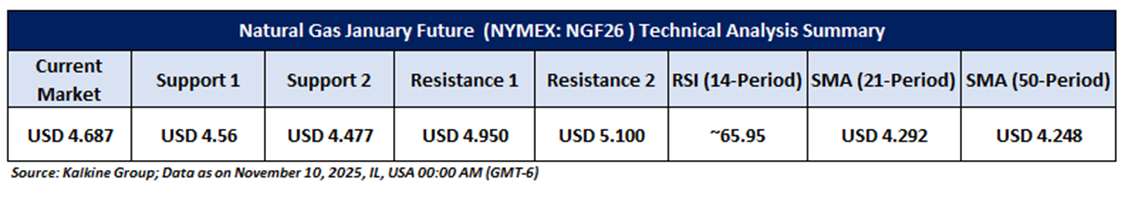
Price Action and Technical Indicator Analysis: Natural Gas January Futures are trading above a key horizontal trendline support, maintaining stability and reinforcing a constructive technical outlook. The contract continues to hold above the 21-period Simple Moving Average (SMA), which serves as a crucial support zone. The 14-period Relative Strength Index (RSI) at 65.95 signals strengthening momentum. As long as prices sustain above the support area, the outlook remains positive, with a decisive breakout above the immediate resistance likely to pave the way for further upside in the near term. Nonetheless, broader market sentiment will remain an important factor influencing overall direction.
Now the next crucial resistance levels appear to be at USD 4.95 and USD 5.10, and prices may test these levels in the coming periods (2-4 weeks).
As per the above-mentioned price action and technical indicators analysis, Natural Gas January Future (NYMEX: NGF26) is looking technically well-placed for a ‘Buy’ rating. Investment decisions should be made depending on an individual’s appetite for downside potential, risks, and any previous holdings. This recommendation is purely based on technical analysis, and fundamental analysis has not been considered in this report. Technical summary of the ‘Buy’ recommendation is as follows:
Upcoming Major Global Economic Events
Market events occur on a day-to-day basis depending on the frequency of the data and generally include an update on employment, inflation, GDP, WASDE report, consumer sentiments, etc. Noted below are the upcoming week's major global economic events that could impact commodities’ prices:
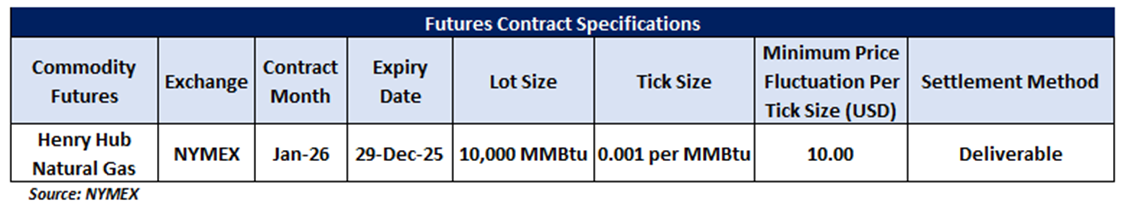
Futures Contract Specifications
Disclaimers
Related Risks: Based on the technical analysis, the risks are defined as per risk-reward ratio (~0.80:1.00), however, returns are generated within a 2-4 weeks’ time frame. This may be looked at by Individuals with sufficient risk appetite looking for returns within short investment duration. The investment recommendations provided in this report are solely based on technical parameters, and the fundamental performance of the commodities has not been considered in the decision-making process. Other factors which could impact commodity prices include market risks, regulatory risks, interest rates risk, currency risks, and social and political instability risks etc.
Note 1: Past performance is not a reliable indicator of future performance.
Note 2: Individuals can consider exiting from the commodity if the Target Price mentioned as per the Technical Analysis has been achieved and subject to the factors discussed above.
Note 3: How to Read the Charts?
The Green colour line reflects the 21-period moving average while the red line indicates the 50- period moving average. SMA helps to identify existing price trend. If the prices are trading above the 21-period and 50-period moving average, then it shows prices are currently trading in a bullish trend.
The Black colour line in the chart’s lower segment reflects the Relative Strength Index (14-Period) which indicates price momentum and signals momentum in trend. A reading of 70 or above suggests overbought status while a reading of 30 or below suggests an oversold status.
The Blue colour bars in the chart’s lower segment show the volume of the commodity. Commodity with high volumes is more liquid compared to the lesser ones. Liquidity in commodity helps in easier and faster execution of the order.
The Orange colour lines are the trend lines drawn by connecting two or more price points and used for trend identification purposes. The trend line also acts as a line of support and resistance.
Technical Indicators Defined: -
Support: A level at which the stock prices tend to find support if they are falling, and a downtrend may take a pause backed by demand or Selling interest. Support 1 refers to the nearby support level for the stock and if the price breaches the level, then Support 2 may act as the crucial support level for the stock.
Resistance: A level at which the stock prices tend to find resistance when they are rising, and an uptrend may take a pause due to profit booking or Selling interest. Resistance 1 refers to the nearby resistance level for the stock and if the price surpasses the level, then Resistance 2 may act as the crucial resistance level for the stock.
Stop-loss: It is a level to protect further losses in case of unfavourable movement in the stock prices.
Risk Reward Ratio: The risk reward ratio is the difference between an entry point to a stop loss and profit level. This report is based on ~80% Stop Loss of the Target 1 from the entry point.
The reference date for all price data, volumes, technical indicators, support, and resistance levels is 10 November 2025. The reference data in this report has been partly sourced from REFINITIV.
Note: Trading decisions require a thorough analysis by individuals. Technical reports, in general, chart out metrics that may be assessed by individuals before any commodity evaluation. The above are illustrative analytical factors used for evaluating the commodity; other parameters can be looked at along with additional risks per side.
Kalkine Equities LLC, with Delaware File Number 4697384, Foreign Qualification Registration in California File Number 202109211078, and Texas File Number 805521396, is authorized to provide general advice only. The information on https://kalkine.com/ does not take into account any of your investment objectives, financial situation or needs. You should consider the appropriateness of advice taking into account your own objectives, financial situation and needs and seek independent financial advice before making any financial decisions. The link to our Terms and Conditions and Privacy Policy has been provided for your reference. On the date of publishing the reports (mentioned on the website), employees and/or associates of Kalkine do not hold positions in any of the stocks covered on the website. These stocks can change any time and readers of the reports should not consider these stocks as advice or recommendations later.
Past performance is not a reliable indicator of future performance.
 Please wait processing your request...