Section 1: Company Overview and Fundamentals Insights
Company Overview: Piedmont Lithium Inc. (NASDAQ: PLL) is a lithium miner focused on enabling the transition to a net zero world and creating a clean energy economy in North America. Its projects include Carolina Lithium and Tennessee Lithium projects in the United States and partnerships in Quebec with Sayona Mining (ASX: SYA) and in Ghana with Atlantic Lithium (ASX: A11). Kalkine’s Global Fully Charged Report covers the Investment Highlights, Management Insights, Key Financial Metrics, Risks, and Technical Analysis along with the Valuation, Target Price, and Recommendation on the stock.
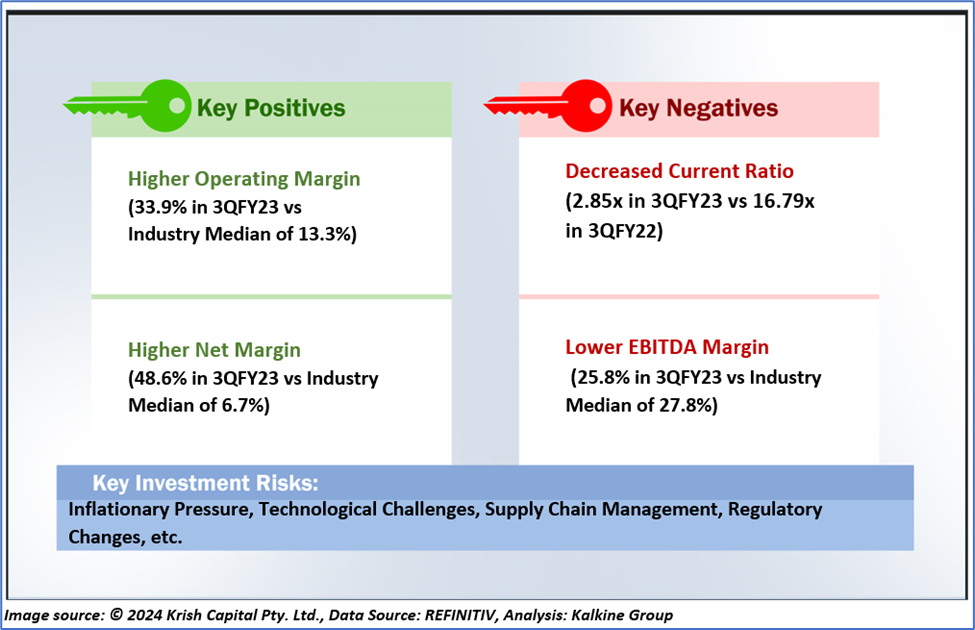
1.2 The Key Positives, Negatives, Investment Highlights, and Risks
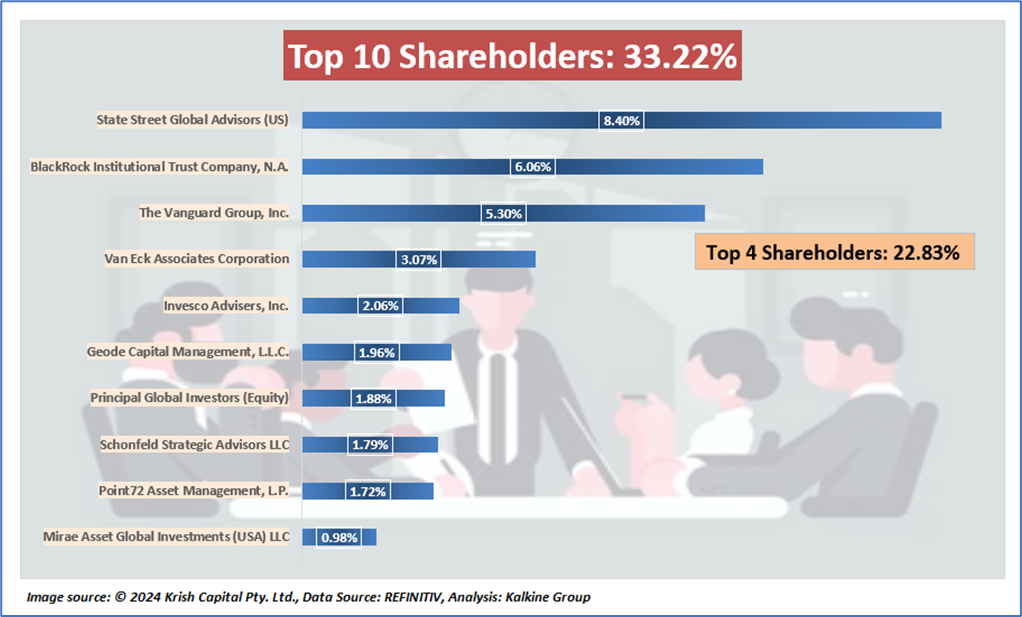
1.3 Top 10 Shareholders:
The top 10 shareholders together form ~33.22% of the total shareholding. State Street Global Advisors (US) and BlackRock Institutional Trust Company, N.A, hold maximum stakes in the company at ~8.40% and ~6.06%, respectively.
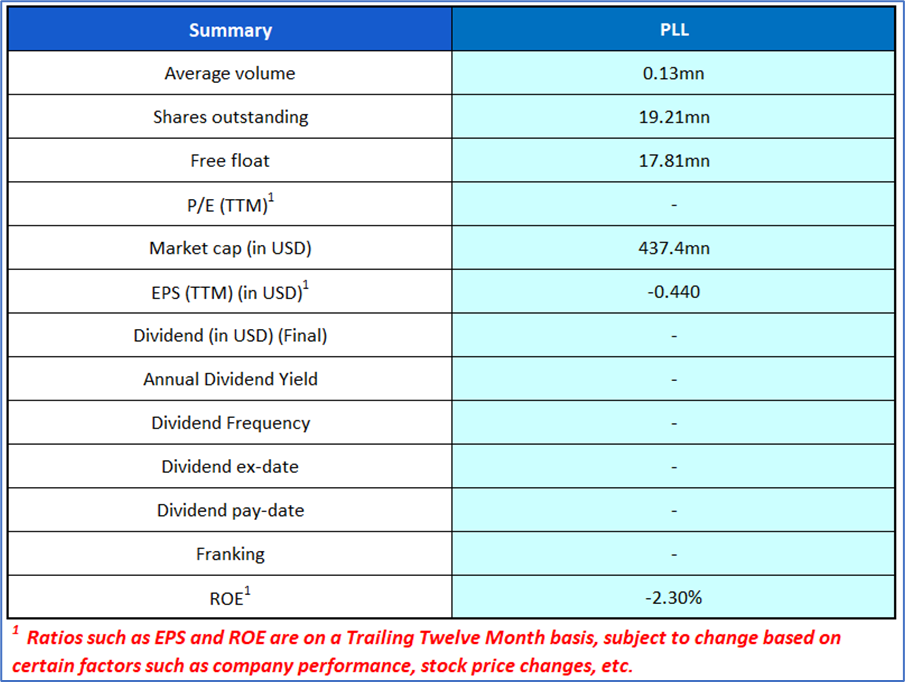
1.4 Key Metrics: PLL's Return on Equity ratio exceeded the industry median of 1.0%, registering a higher value of 6.8% in 3QFY23. Below are captured other metrics:

Section 2: Business Updates, Financial and Operational Highlights
2.1 Recent Business Updates:

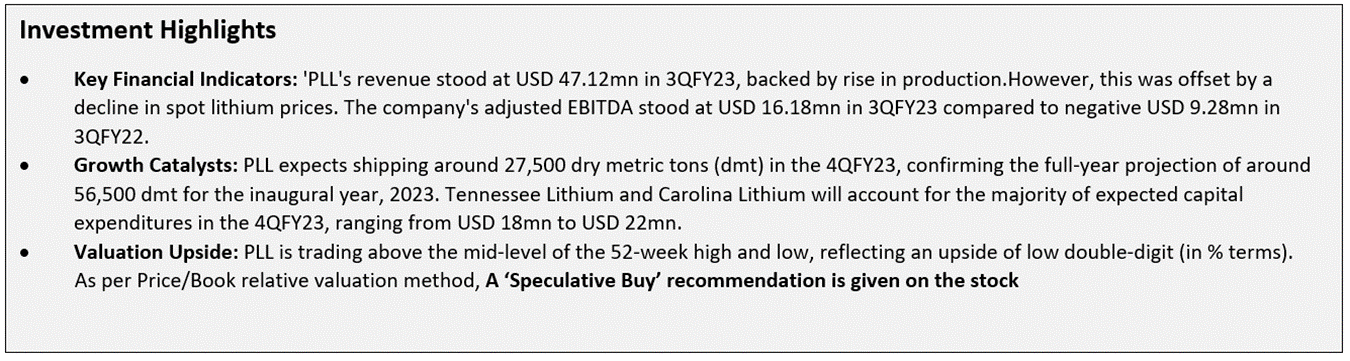
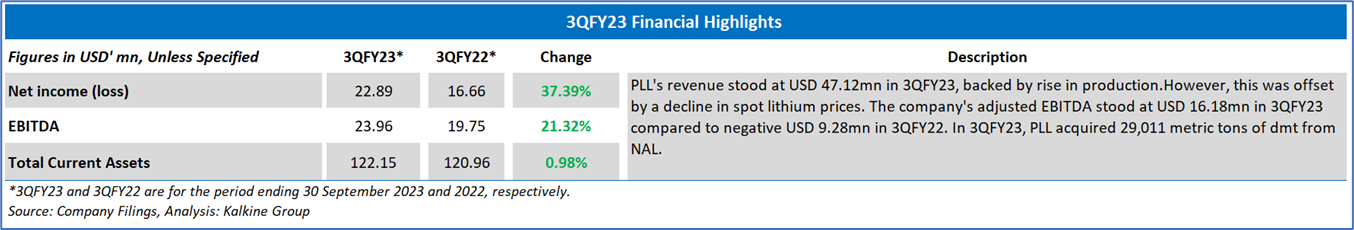
2.2 3QFY23 Results Highlights (for the period ended 30 September 2023): Below mentioned are some key financial highlights:
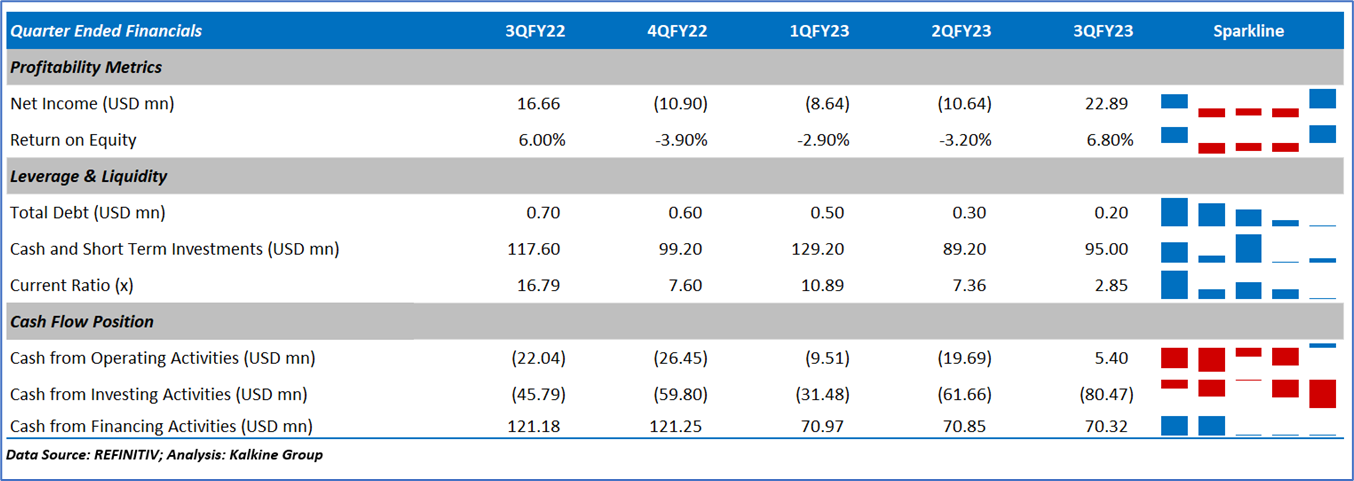
2.3 Historical Financial Trend
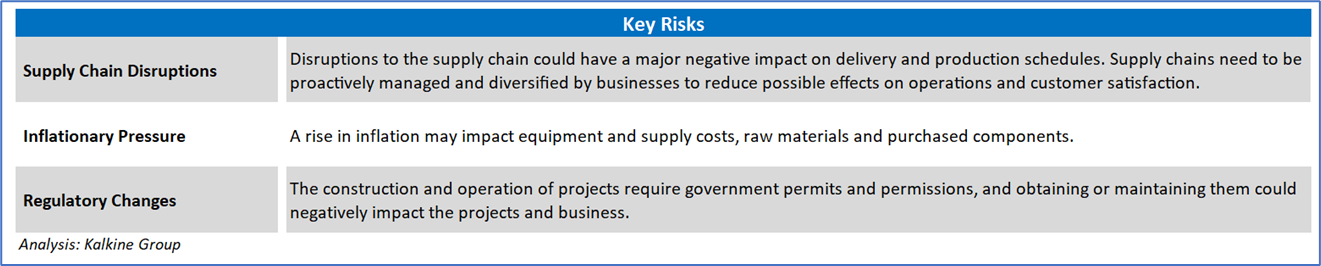
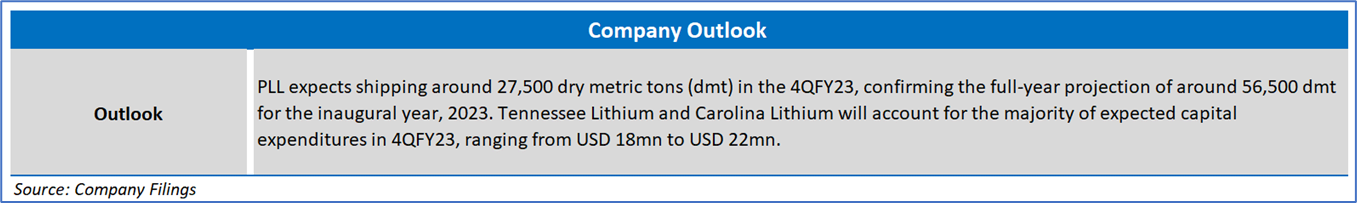
Section 3: Key Risks and Outlook:
Section 4: Stock Recommendation Summary
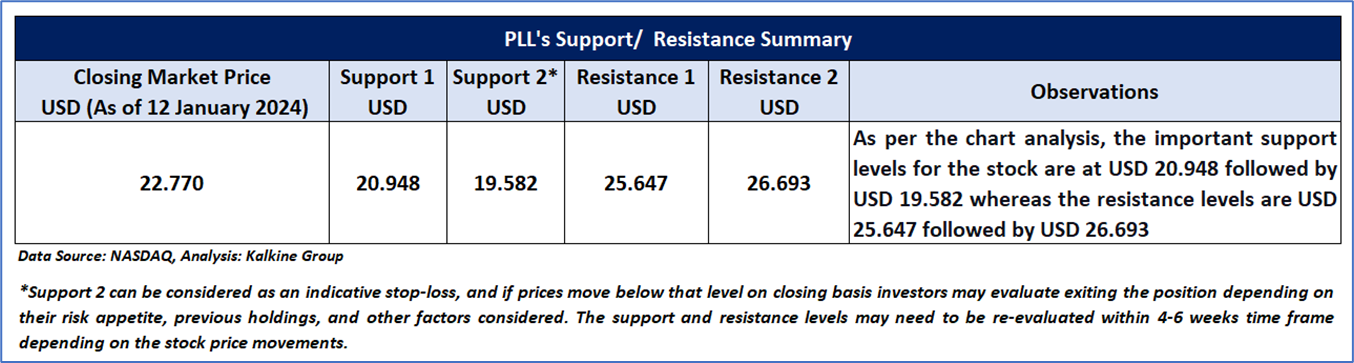
4.1 Price Performance and Technical Summary
The stock has declined by ~36.38% in the last 3 months, whereas over the last 1 year, the stock has witnessed a dip of ~62.48%. The stock has a 52-week low and 52-week high of USD 22.57 and USD 76.77, respectively, and is currently trading above the average of 52-week high and low. PLL was last covered in a report dated ‘15 December 2023’.

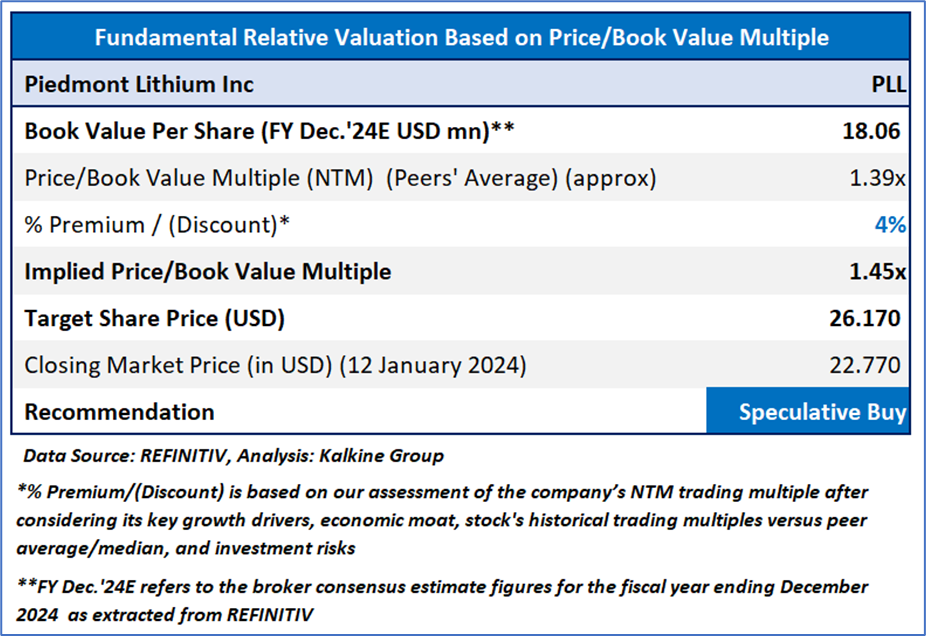
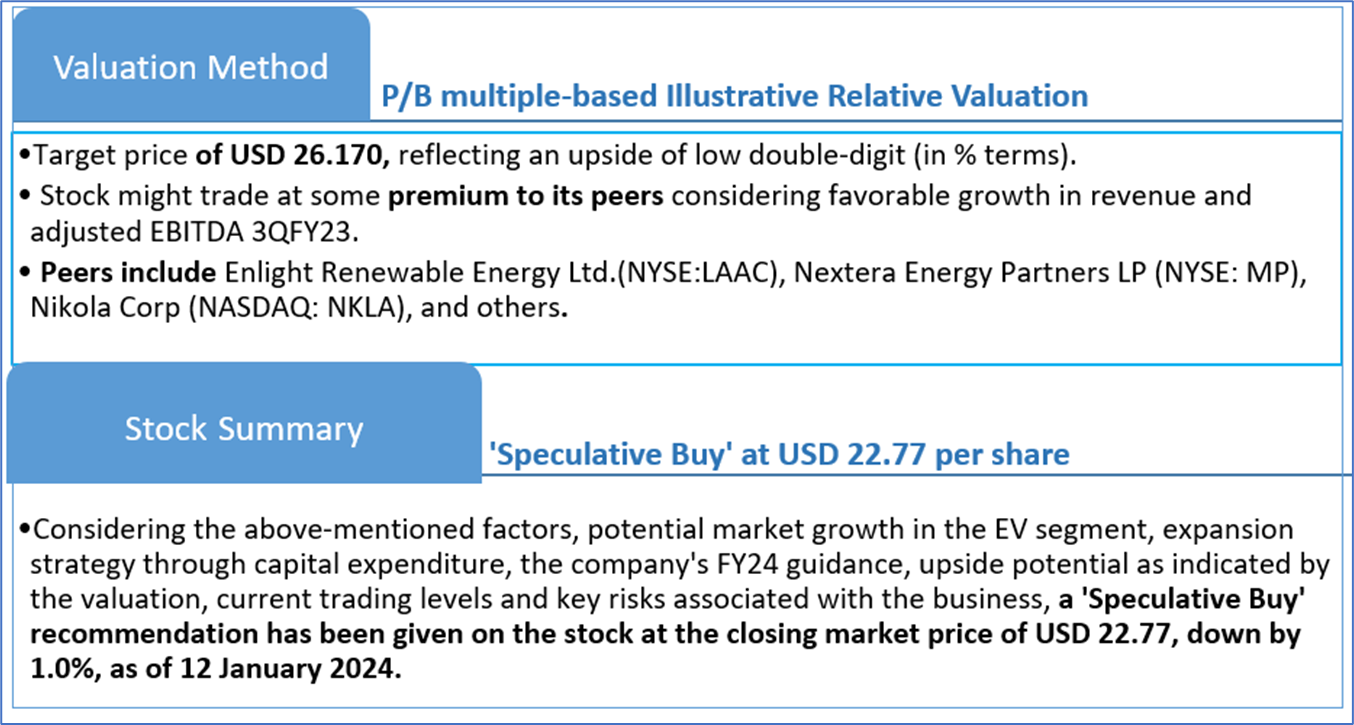
4.2 Fundamental Valuation
Valuation Methodology: P/B Multiple Based Relative Valuation (Illustrative)
Markets are trading in a highly volatile zone currently due to certain macro-economic issues and geopolitical tensions prevailing. Therefore, it is prudent to follow a cautious approach while investing.
Note 1: Past performance is neither an indicator nor a guarantee of future performance.
Note 2: The reference date for all price data, currency, technical indicators, support, and resistance levels is 12 January 2024. The reference data in this report has been partly sourced from REFINITIV.
Note 3: Investment decisions should be made depending on an individual's appetite for upside potential, risks, holding duration, and any previous holdings. An 'Exit' from the stock can be considered if the Target Price mentioned as per the Valuation and or the technical levels provided has been achieved and is subject to the factors discussed above.
Note 4: Dividend Yield may vary as per the stock price movement.
Technical Indicators Defined: -
Support: A level at which the stock prices tend to find support if they are falling, and a downtrend may take a pause backed by demand or buying interest. Support 1 refers to the nearby support level for the stock and if the price breaches the level, then Support 2 may act as the crucial support level for the stock.
Resistance: A level at which the stock prices tend to find resistance when they are rising, and an uptrend may take a pause due to profit booking or selling interest. Resistance 1 refers to the nearby resistance level for the stock and if the price surpasses the level, then Resistance 2 may act as the crucial resistance level for the stock.
Stop-loss: It is a level to protect further losses in case of unfavourable movement in the stock prices.
Kalkine Equities LLC provides general information about companies and their securities. The information contained in the reports, including any recommendations regarding the value of or transactions in any securities, does not take into account any of your investment objectives, financial situation or needs. Kalkine Equities LLC is not registered as an investment adviser in the U.S. with either the federal or state government. Before you make a decision about whether to invest in any securities, you should take into account your own objectives, financial situation and needs and seek independent financial advice. All information in our reports represents our views as at the date of publication and may change without notice.
Kalkine Media LLC, an affiliate of Kalkine Equities LLC, may have received, or be entitled to receive, financial consideration in connection with providing information about certain entity(s) covered on its website.
Past performance is not a reliable indicator of future performance.
 Please wait processing your request...