
Kalkine's Global Tariff Report offers independent, data-driven analysis of key global sectors impacted by tariff adjustments. It evaluates the potential implications these changes may have for equity valuations within those industries. The report prioritizes trade-sensitive sectors, which typically face increased investor scrutiny during periods of tariff uncertainty, while also identifying defensive and countercyclical segments that demonstrate resilience or potential for outperformance amidst global trade disruptions.
As illustrated in the table below, several key sectors in different countries are directly impacted by the recent tariff announcement from President Trump.
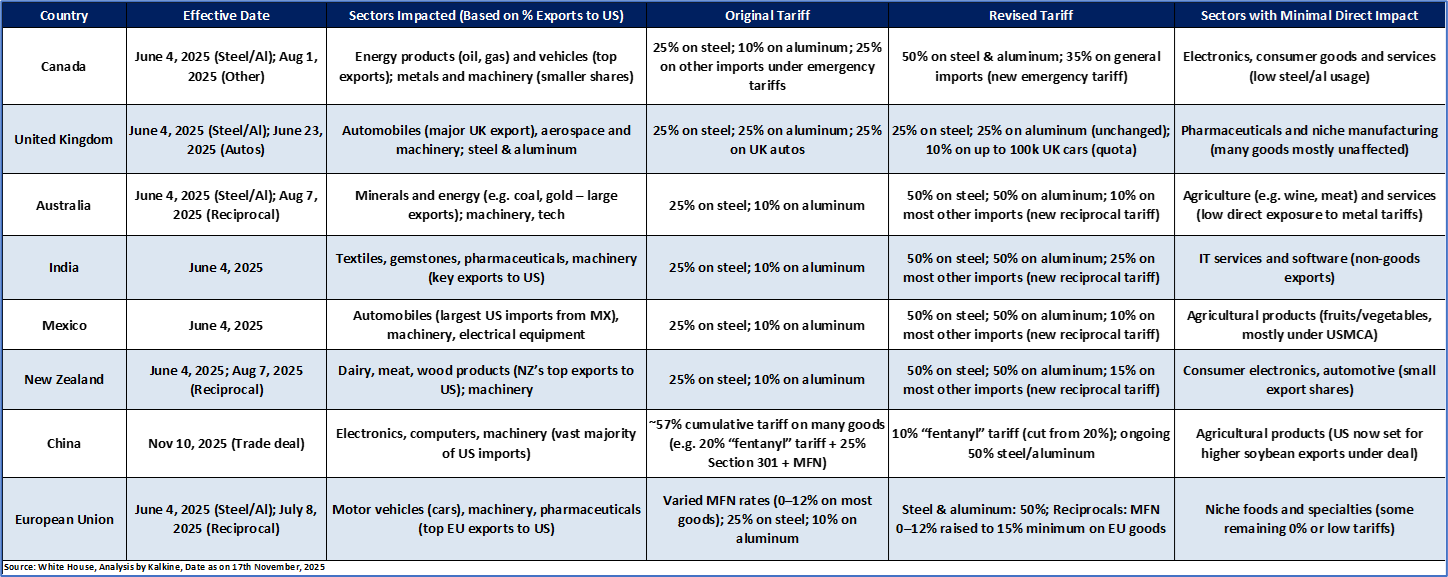

Key Developments (as of November 17th, 2025)
Canada
India
China
European Union

In August 2025, Canada’s trade in services surplus narrowed to CAD ~0.3 bn in August 2025 from CAD ~0.4 bn in July as exports slipped 0.2% to CAD ~18.7 bn while imports held steady at CAD ~18.4 bn. Travel exports fell 1.7% due to lower foreign visitor spending, but commercial service exports rose 0.8% on stronger financial activity. Imports of commercial services also rose 0.8%, offset by declines in transportation and travel services. The combined goods and services trade deficit widened to CAD ~6.0 bn for the month.
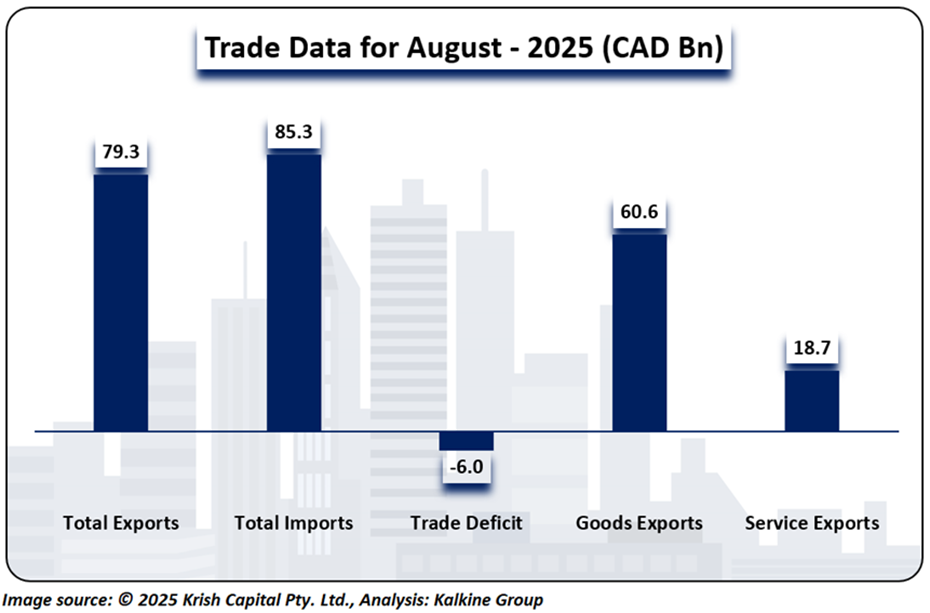


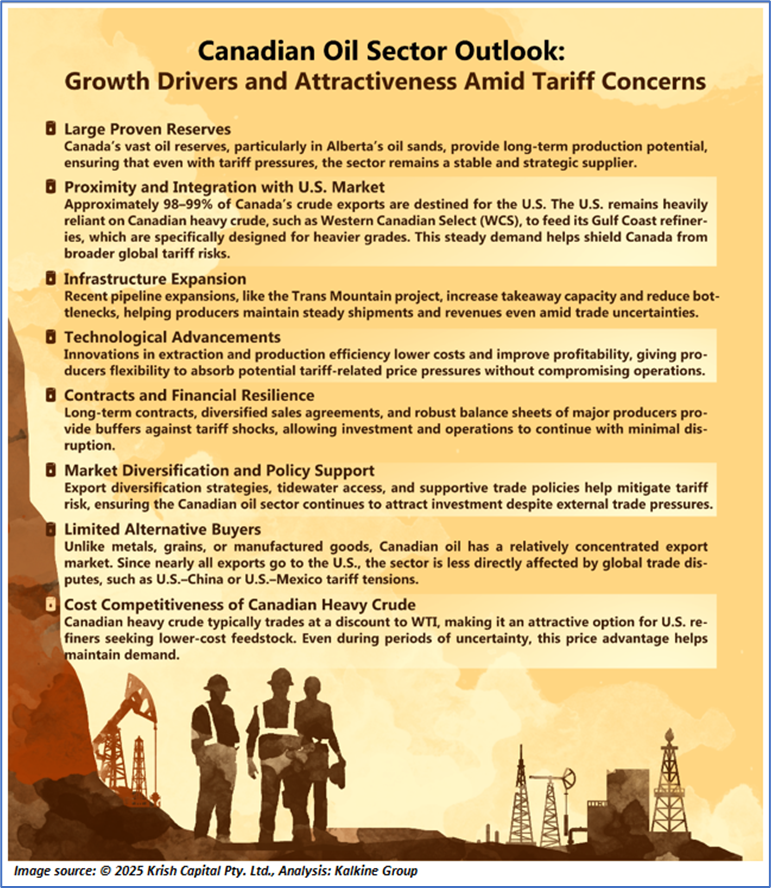
Image source: © 2025 Krish Capital Pty. Ltd., Analysis: Kalkine Group

Amid elevated Market Volatility and Tariff pressures, Parex Resources Inc. (TSX: PXT) stands out as our defensive pick within the Oil sector, supported by rigorous fundamental and technical research.
Section1: Company Overview and Fundamental Insights:

Parex Resources Inc. (TSX: PXT) engages in exploration, development, and production of crude oil. The company brings technology utilized in the Western Canada Sedimentary Basin to South American basins with large oil-in-place potential. Majority of the company's properties are focused in Colombia, where it pays a royalty or tax to the government for its operations. Parex depends on a team of geologists and geophysicists, in partnership with technologies such as 3D seismic surveying, to help exploration efforts. Oil production is sold to a small basket of participants in South and North America.
Kalkine’s Global Tariff Report covers the Investment Highlights, Key Financial Metrics, Risks, Technical Analysis along with the Valuation, Target Price, and Recommendation on the stock.
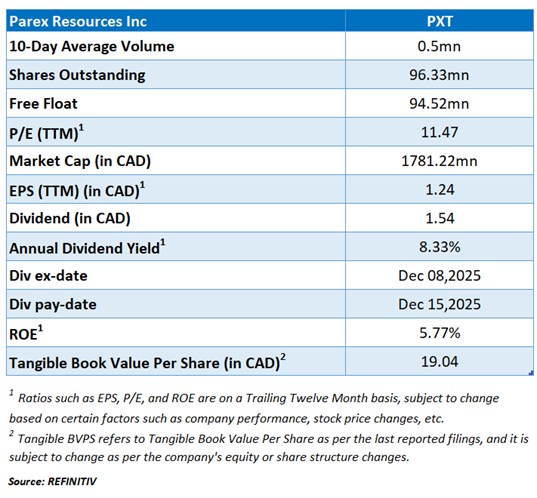


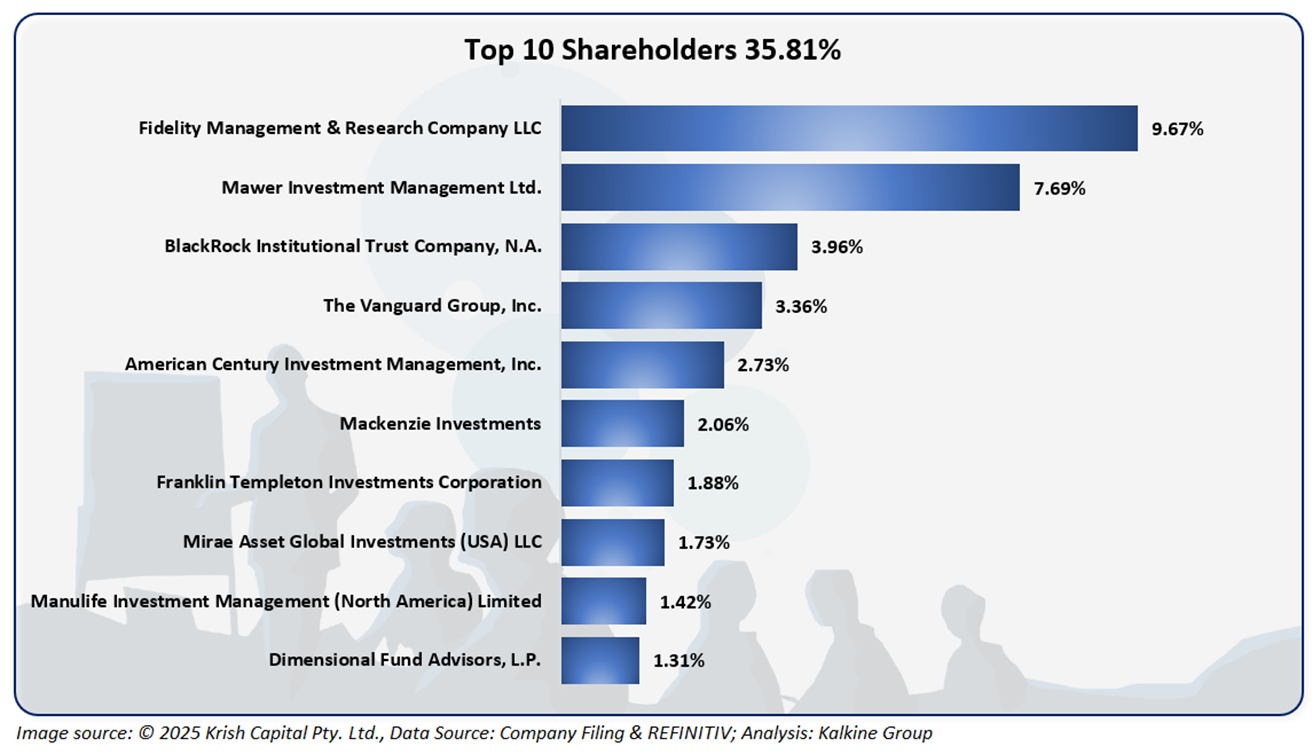
The top 10 shareholders together form ~35.81% of the total shareholding. Fidelity Management & Research Company LLC and Mawer Investment Management Ltd. hold a maximum stake in the company at ~9.67% and ~7.69%, respectively.

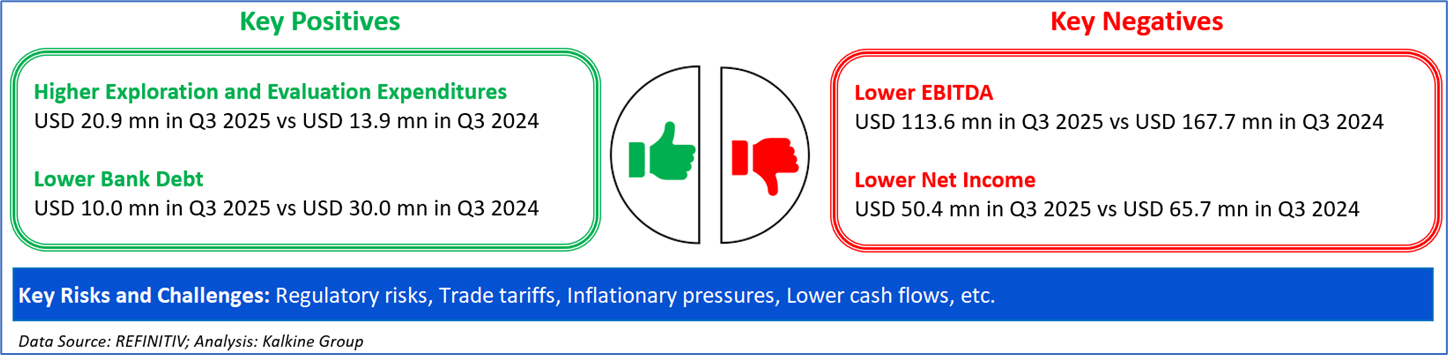
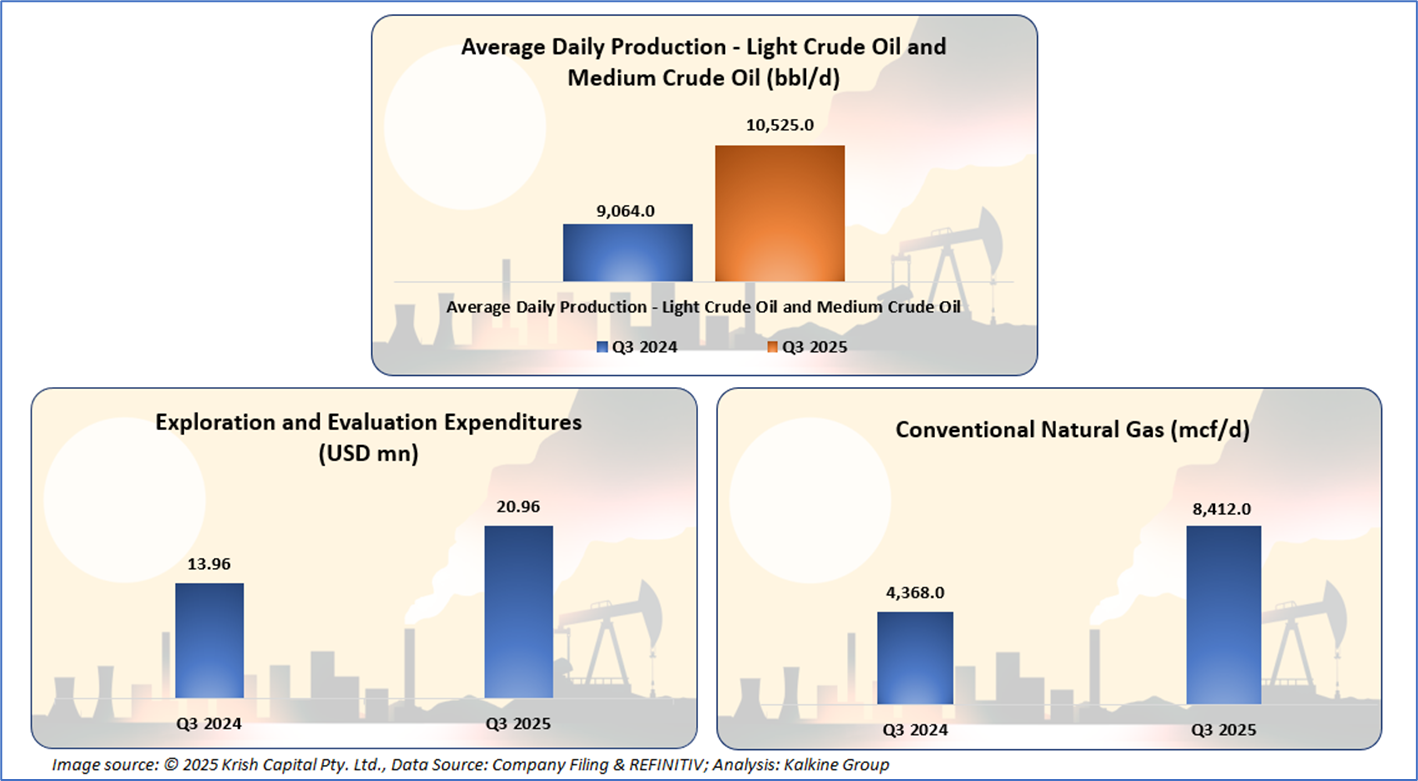
The company reported rising financials in Q3 2025, where it clocked healthy growth under its Average Daily Production - Light Crude Oil and Medium Crude Oil, which is a key positive. Furthermore, it witnessed elevated Conventional Natural Gas and Exploration and Evaluation Expenditures, displaying its balanced production mix and continued investment in future growth.
Section 2: Business Updates and Financial Highlights

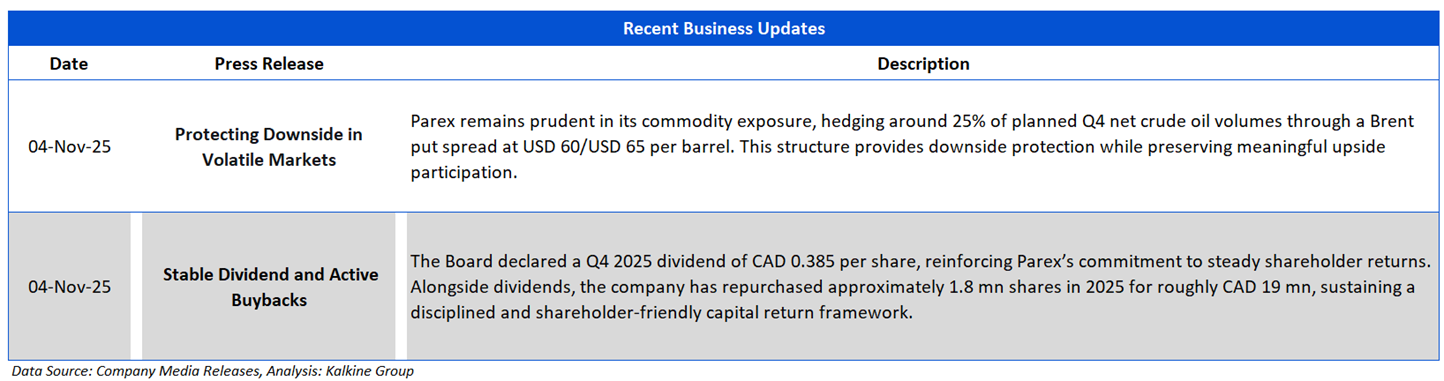
The picture below gives an overview of the company’s recent activities, such as an announcement regarding protecting downside in volatile markets, stable dividend and active buybacks

Section 3: Key Risks and Company Outlook
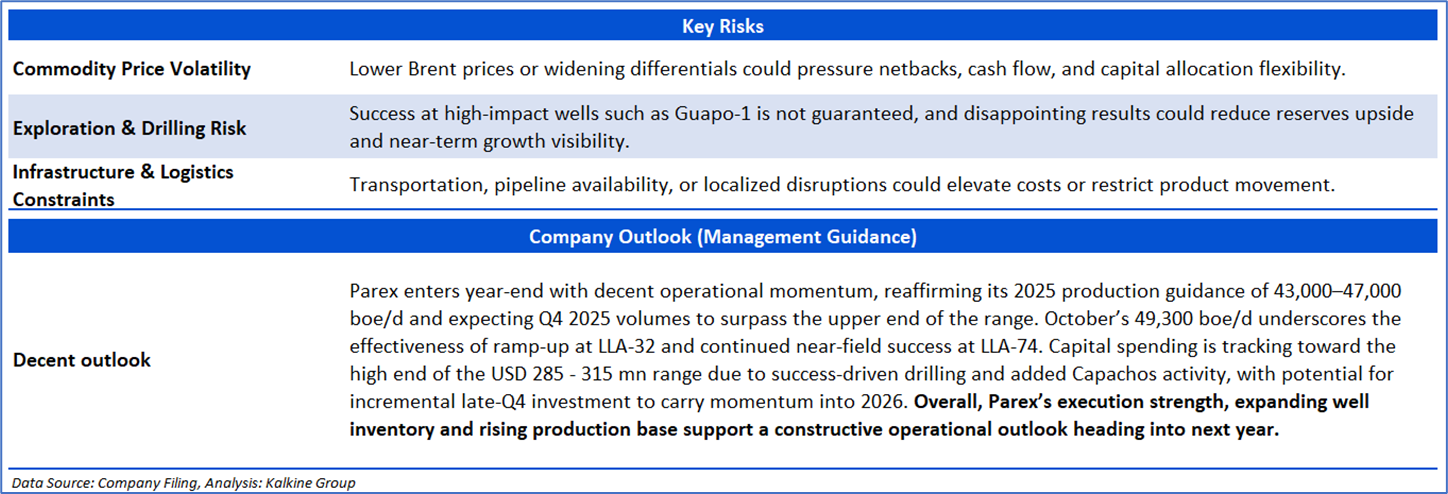
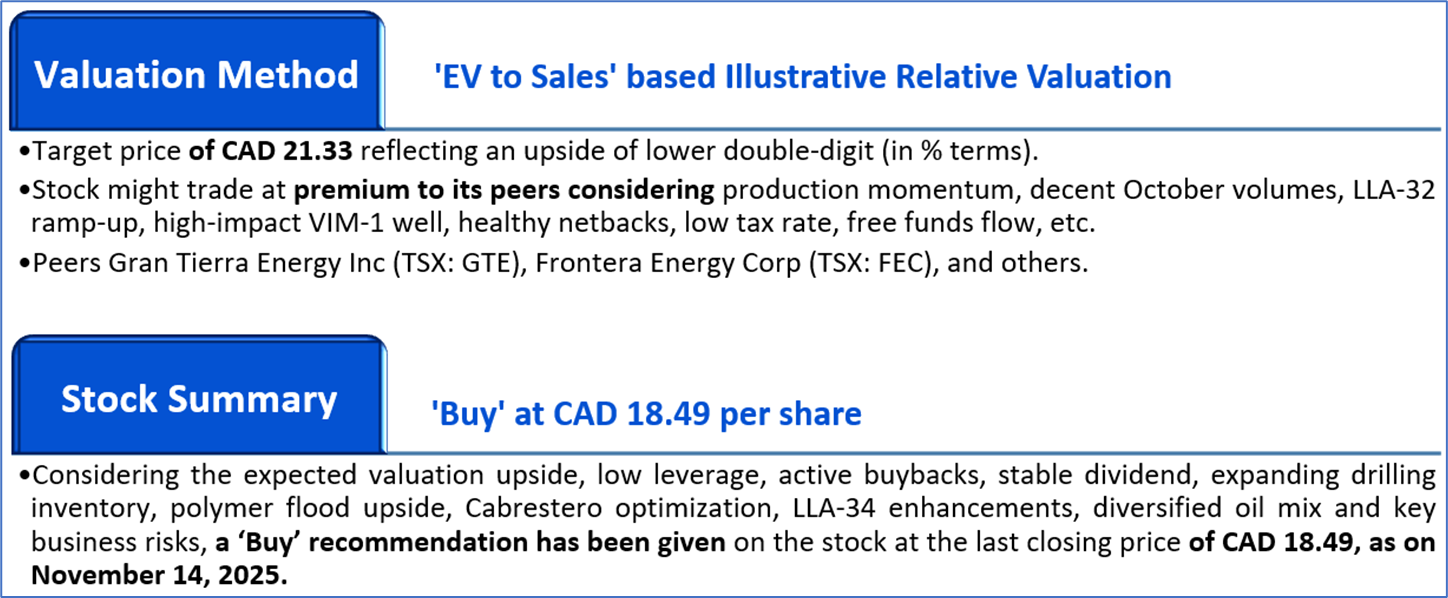
Section 4: Stock Recommendation Summary


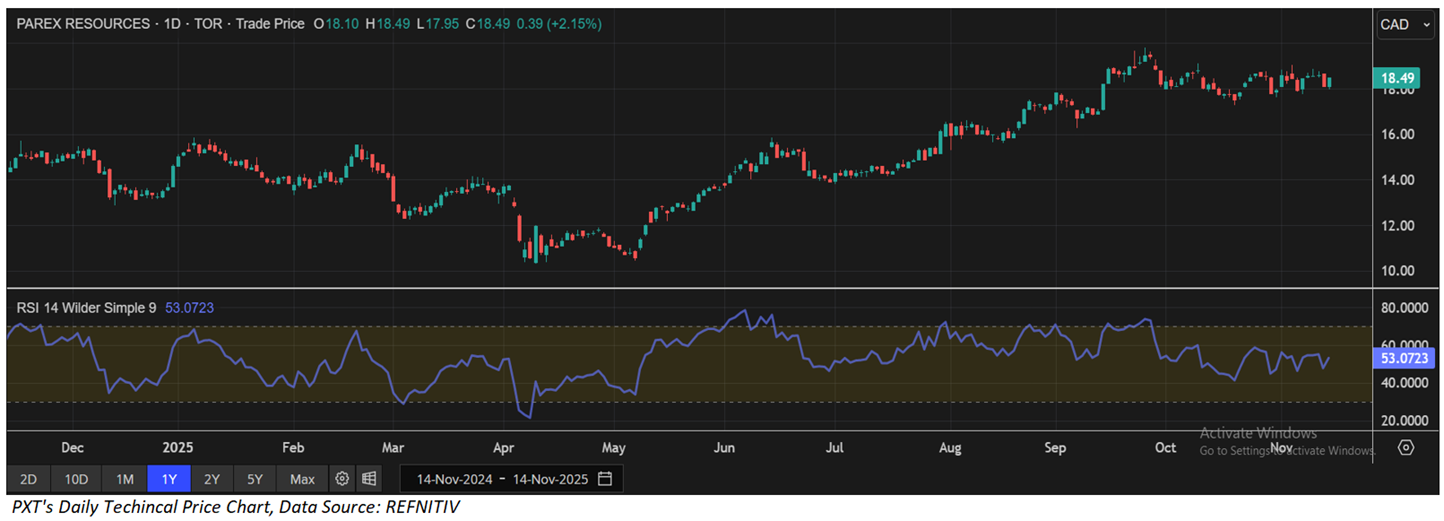
The stock has witnessed an upside of ~0.21% and ~44.56% over the last 1 week and 6 months respectively. Moreover, it is trading above the average 52-week high price of CAD 19.81 and 52-week low price of CAD 10.30, providing an opportunity to ride the trend.

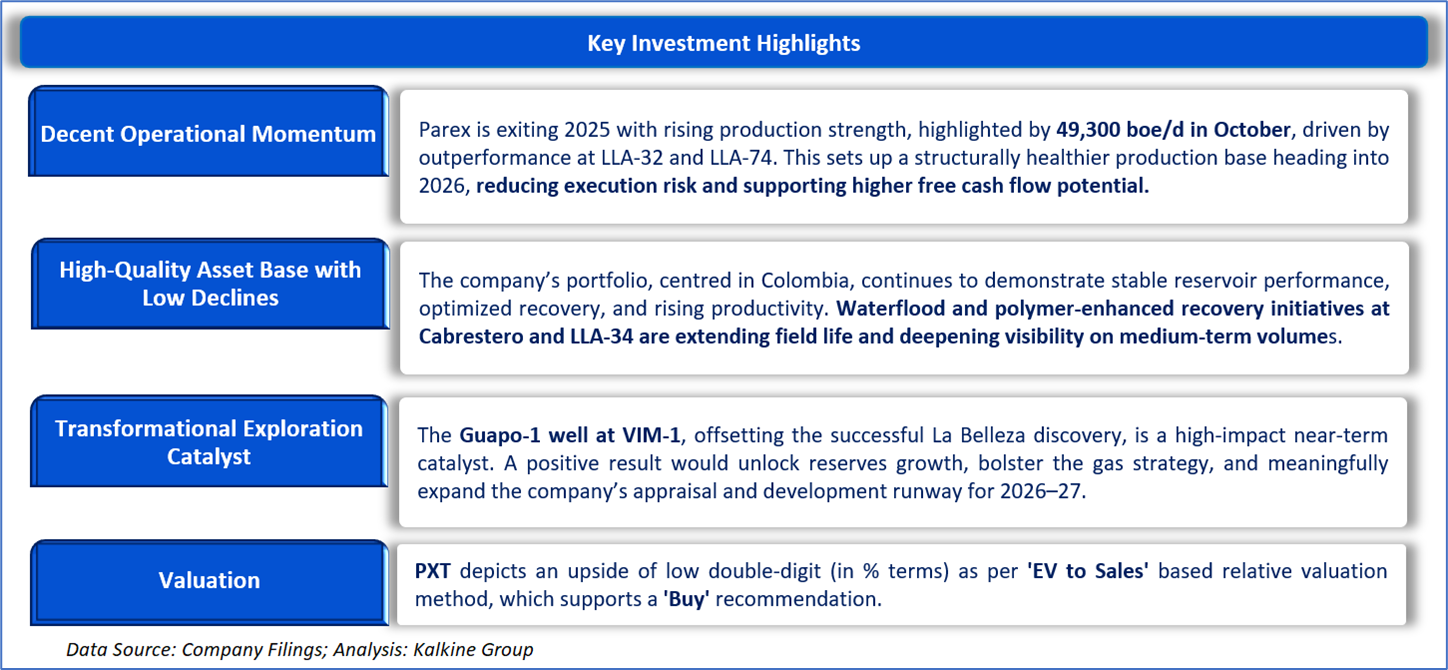
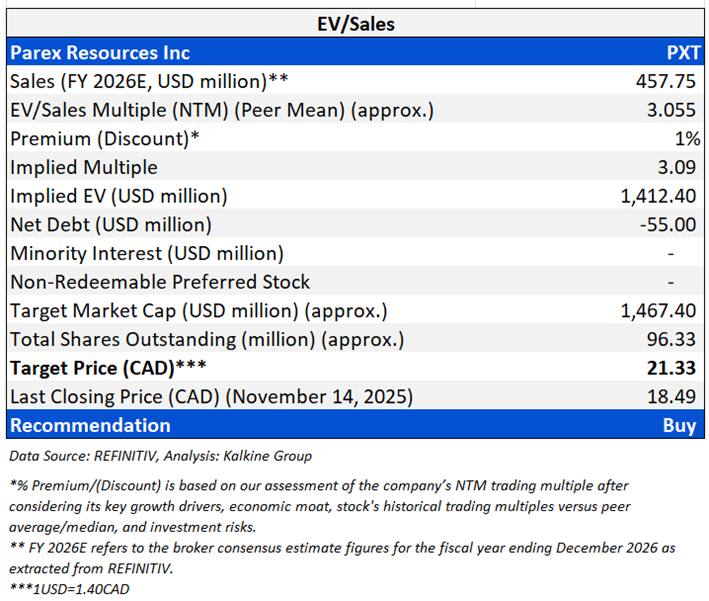
Valuation Methodology: EV to Sales Based Relative Valuation (Illustrative):
Markets are trading in a highly volatile zone currently due to certain macroeconomic issues and geopolitical tensions prevailing. Therefore, it is prudent to follow a cautious approach while investing.
Note 1: Past performance is not a reliable indicator of future performance.
Note 2: The reference date for all price data, currency, technical indicators, support, and resistance levels is November 14, 2025. The reference data in this report has been partly sourced from REFINITIV.
Note 3: Investment decisions should be made depending on an individual's appetite for upside potential, risks, holding duration, and any previous holdings. An 'Exit' from the stock can be considered if the Target Price mentioned as per the Valuation and or the technical levels provided has been achieved and is subject to the factors discussed above.
Note 4: Dividend Yield may vary as per the stock price movement.
Note 5: Kalkine reports are prepared based on the stock prices captured either from REFINITIV or Trading View. Typically, REFINITIV or Trading View may reflect stock prices with a delay which could be a lag of 25-30 minutes. There can be no assurance that future results or events will be consistent with the information provided in the report. The information is subject to change without any prior notice.
Technical Indicators Defined: -
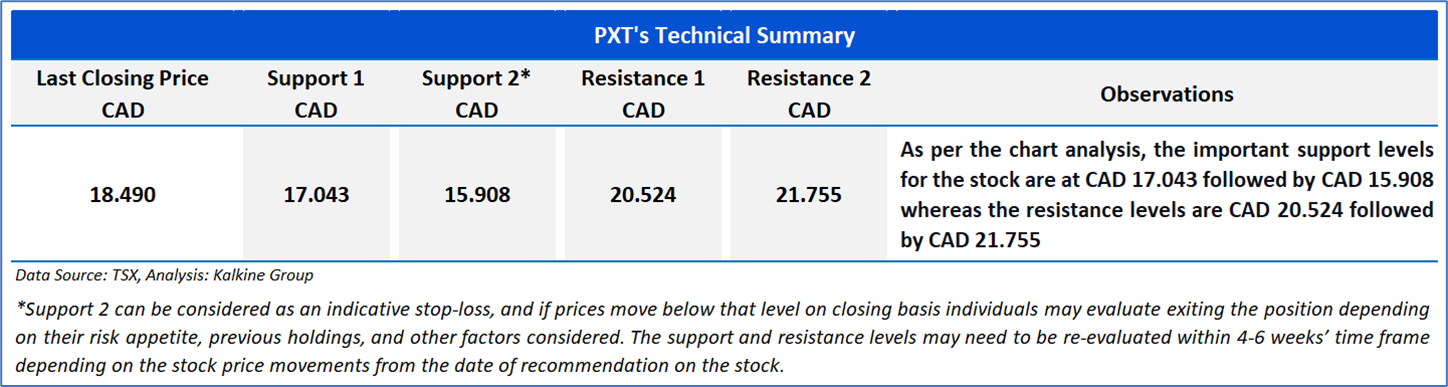
Support: A level at which the stock prices tend to find support if they are falling, and a downtrend may take a pause backed by demand or buying interest. Support 1 refers to the nearby support level for the stock and if the price breaches the level, then Support 2 may act as the crucial support level for the stock.
Resistance: A level at which the stock prices tend to find resistance when they are rising, and an uptrend may take a pause due to profit booking or selling interest. Resistance 1 refers to the nearby resistance level for the stock and if the price surpasses the level, then Resistance 2 may act as the crucial resistance level for the stock.
Stop-loss: It is a level to protect further losses in case of unfavourable movement in the stock prices.
Kalkine Equities LLC, with Delaware File Number 4697384, Foreign Qualification Registration in California File Number 202109211078, and Texas File Number 805521396, is authorized to provide general advice only. The information on https://kalkine.com/ does not take into account any of your investment objectives, financial situation or needs. You should consider the appropriateness of advice taking into account your own objectives, financial situation and needs and seek independent financial advice before making any financial decisions. The link to our Terms and Conditions and Privacy Policy has been provided for your reference. On the date of publishing the reports (mentioned on the website), employees and/or associates of Kalkine do not hold positions in any of the stocks covered on the website. These stocks can change any time and readers of the reports should not consider these stocks as advice or recommendations later.
Past performance is not a reliable indicator of future performance.
 Please wait processing your request...