
Section 1: Company Overview and Fundamentals
1.1 Company Overview:
Oscar Health, Inc. (NYSE: OSCR) is a health insurance company, which has built a full stack technology platform focused on serving its members. It offers individual and family, and small group plans, and +Oscar, its full stack technology platform, to others within the provider and payor space. Its individual market primarily consists of policies purchased by individuals and families through health insurance marketplaces.
Kalkine’s Diversified Opportunities Report covers the Company Overview, Key positives & negatives, Investment summary, Key investment metrics, Top 10 shareholding, Business updates and insights into company recent financial results, Key Risks & Outlook, Price performance and technical summary, Target Price, and Recommendation on the stock.
Stock Performance:

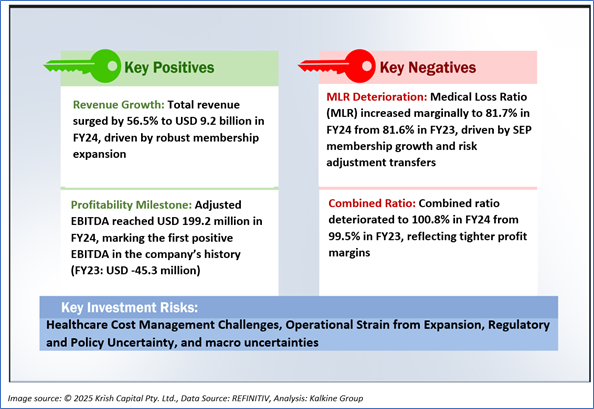
1.2 The Key Positives, Negatives, and Investment summary
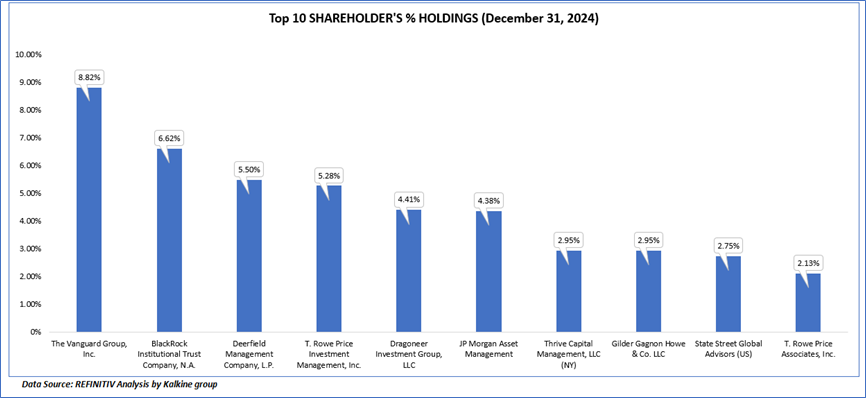
1.3 Top 10 shareholders:
The top 10 shareholders together form ~45.79% of the total shareholding, signifying concentrated shareholding. The Vanguard Group, Inc., and BlackRock Institutional Trust Company, N.A., are the biggest shareholders, holding the maximum stake in the company at 8.82% and 6.62%, respectively.
1.4 Key Metrics
Oscar Health, Inc. exhibited robust revenue growth, achieving a four-year CAGR of 81.74%, with revenue rising from USD 462.8 million in 2020 to USD 9,177.56 million in 2024. Despite recording consistent net losses between 2020 and 2023, the company transitioned to profitability in 2024, reporting a net income of USD 26.1 million compared to a net loss of USD 270.6 million in 2023, reflecting significant operational improvements.

Section 2: Business Updates and Corporate Business Highlights
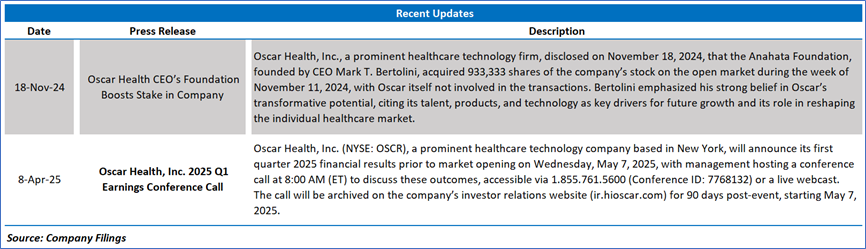
2.1 Recent Updates:
The below picture gives an overview of the recent updates:
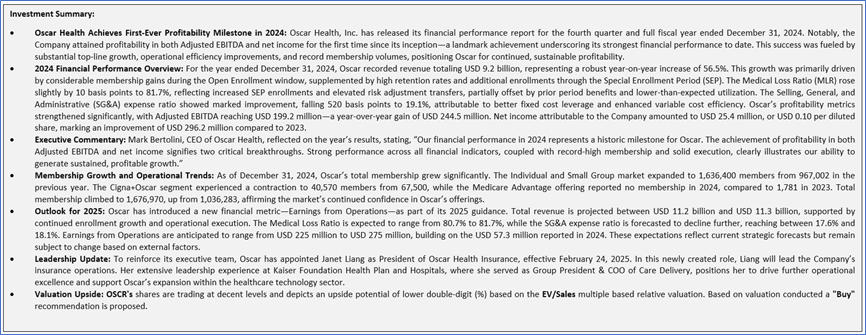
2.2 Insights of FY24:

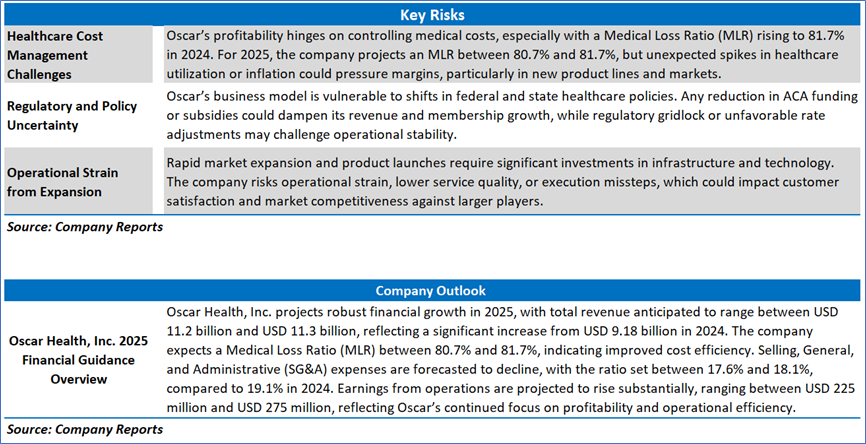
Section 3: Key Risks & Outlook
Section 4: Stock Recommendation Summary:
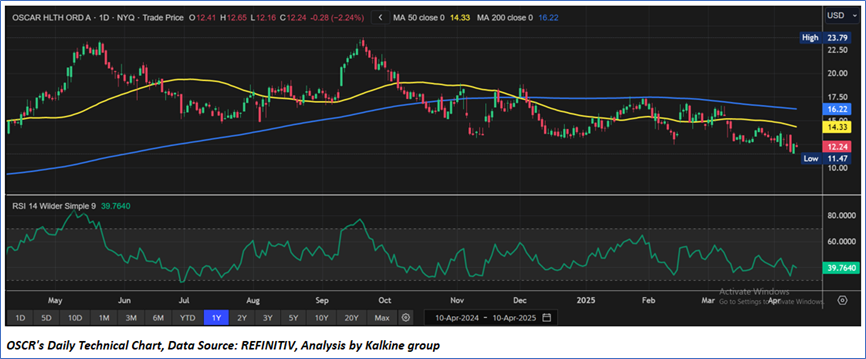
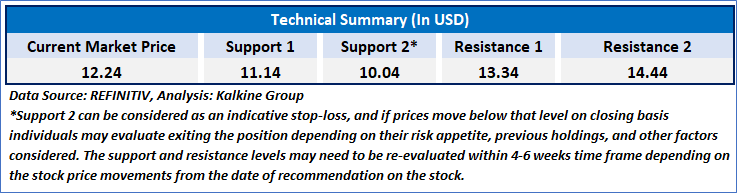
4.1 Price Performance and Technical Summary:
Stock Performance:
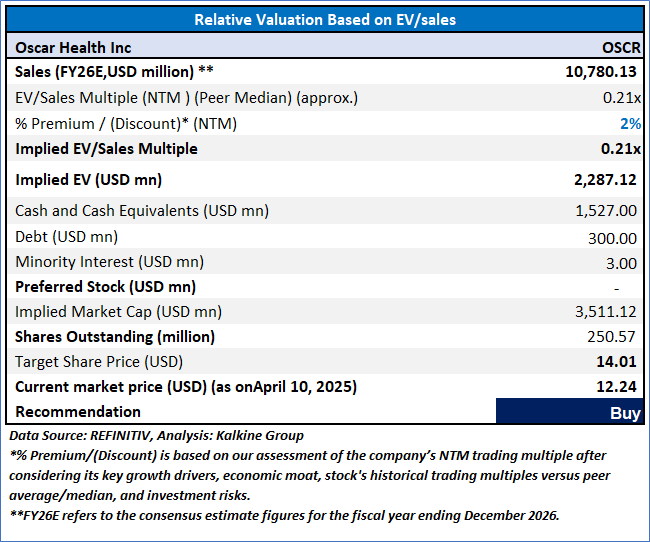
4.2 Fundamental Valuation
Valuation Methodology: EV/Sales Multiple Based Relative Valuation

Markets are trading in a highly volatile zone currently due to certain macroeconomic issues and geopolitical tensions prevailing. Therefore, it is prudent to follow a cautious approach while investing.
Note 1: Past performance is not a reliable indicator of future performance.
Note 2: The reference date for all price data, currency, technical indicators, support, and resistance levels is April 10, 2025. The reference data in this report has been partly sourced from REFINITIV.
Note 3: Investment decisions should be made depending on an individual's appetite for upside potential, risks, holding duration, and any previous holdings. An 'Exit' from the stock can be considered if the Target Price mentioned as per the Valuation and or the technical levels provided has been achieved and is subject to the factors discussed above.
Note 4: The report publishing date is as per the Pacific Time Zone.
Technical Indicators Defined: -
Support: A level at which the stock prices tend to find support if they are falling, and a downtrend may take a pause backed by demand or buying interest. Support 1 refers to the nearby support level for the stock and if the price breaches the level, then Support 2 may act as the crucial support level for the stock.
Resistance: A level at which the stock prices tend to find resistance when they are rising, and an uptrend may take a pause due to profit booking or selling interest. Resistance 1 refers to the nearby resistance level for the stock and if the price surpasses the level, then Resistance 2 may act as the crucial resistance level for the stock.
Stop-loss: It is a level to protect against further losses in case of unfavorable movement in the stock prices.
Kalkine Equities LLC, with Delaware File Number 4697384, Foreign Qualification Registration in California File Number 202109211078, and Texas File Number 805521396, is authorized to provide general advice only. The information on https://kalkine.com/ does not take into account any of your investment objectives, financial situation or needs. You should consider the appropriateness of advice taking into account your own objectives, financial situation and needs and seek independent financial advice before making any financial decisions. The link to our Terms and Conditions and Privacy Policy has been provided for your reference. On the date of publishing the reports (mentioned on the website), employees and/or associates of Kalkine do not hold positions in any of the stocks covered on the website. These stocks can change any time and readers of the reports should not consider these stocks as advice or recommendations later.
Past performance is not a reliable indicator of future performance.
 Please wait processing your request...