
Section 1: Company Overview and Fundamentals
1.1 Company Overview:
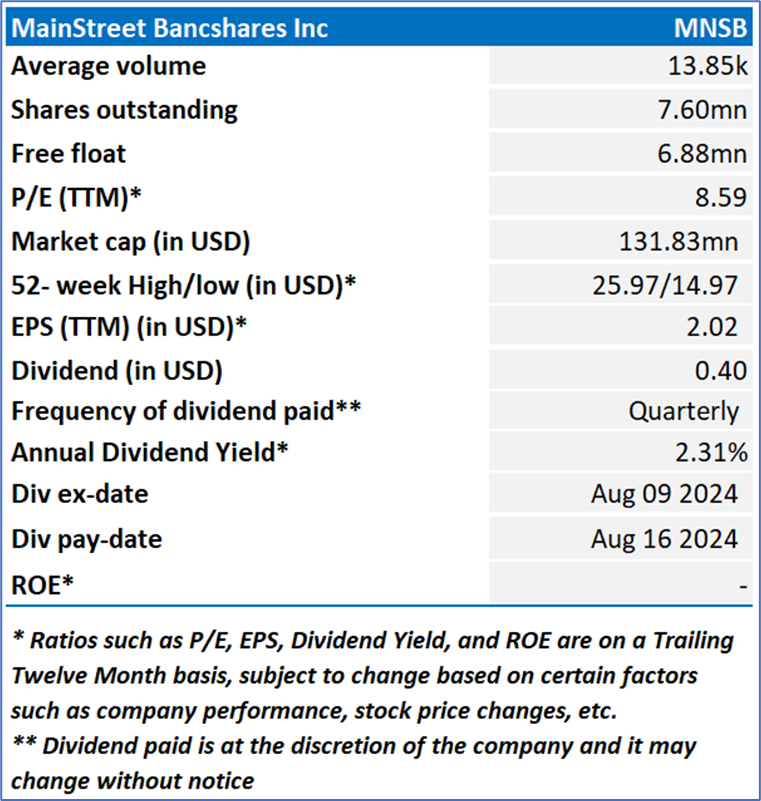
MainStreet Bancshares, Inc. (NASDAQ: MNSB) is a bank holding company, which owns MainStreet Bank (the Bank) and MainStreet Community Capital, LLC. The Bank is a community bank focused on serving the borrowing, cash management and depository needs of retail customers, small to medium-sized businesses, and professionals. The Company's products and services include business and consumer checking, premium interest-bearing checking, business account analysis, savings, certificates of deposit and other depository services, as well as an array of commercial, real estate and consumer loans.
Kalkine’s Diversified Opportunities Report covers the Company Overview, Key positives & negatives, Investment summary, Key investment metrics, Top 10 shareholding, Business updates and insights into company recent financial results, Key Risks & Outlook, Price performance and technical summary, Target Price, and Recommendation on the stock.
Stock Performance:
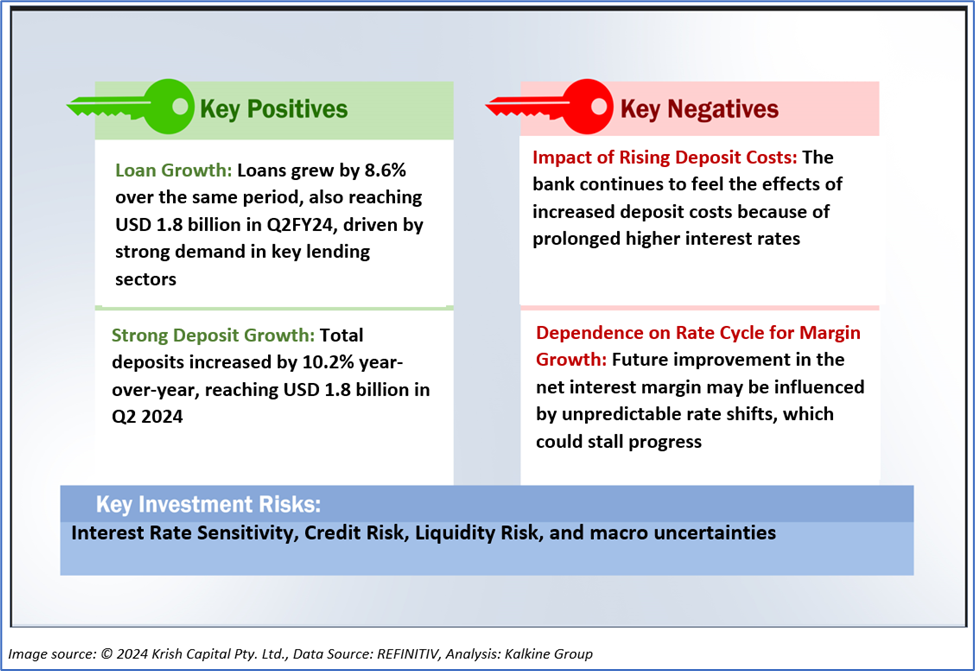
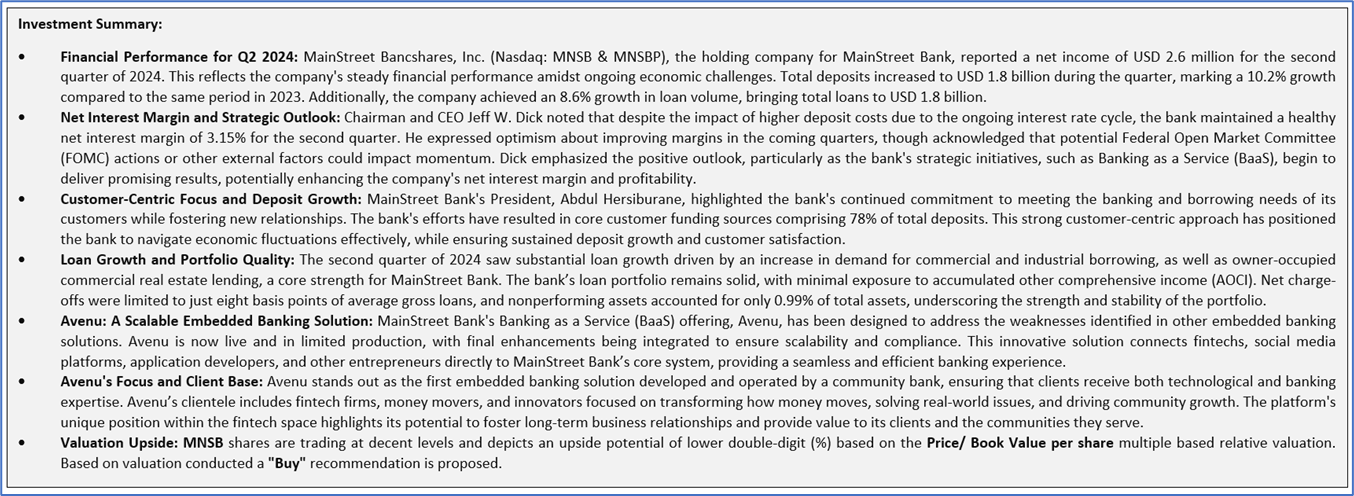
1.2 The Key Positives, Negatives, and Investment summary
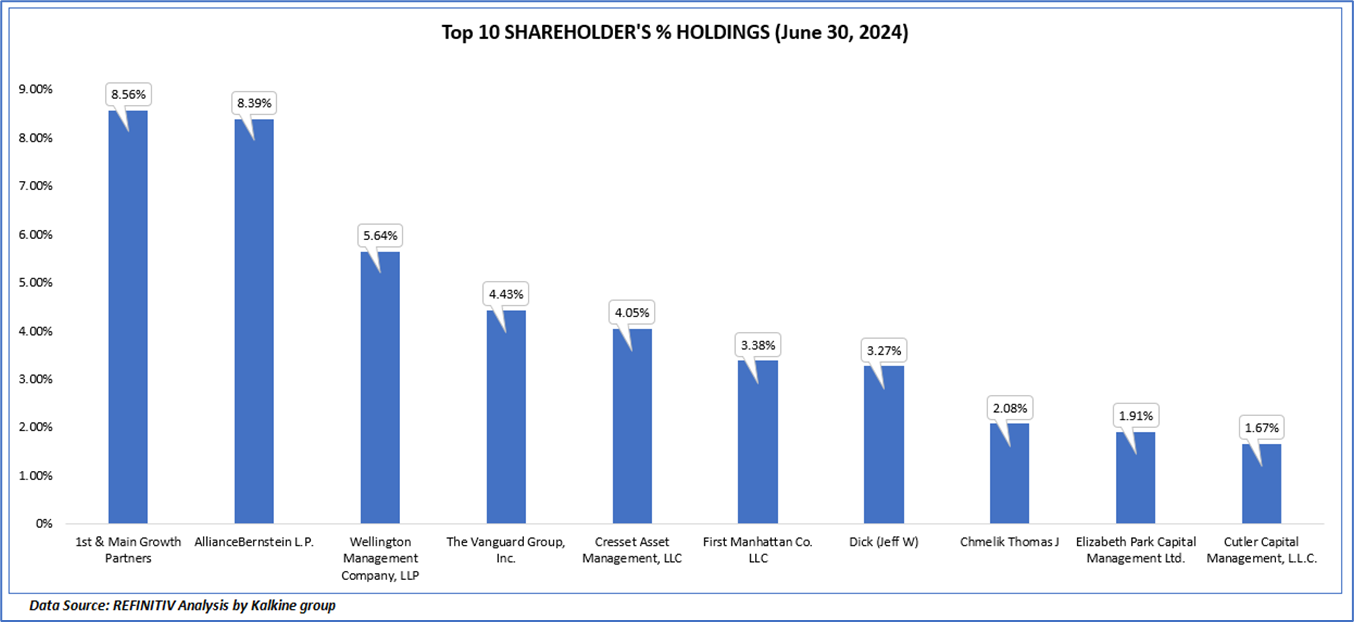
1.3 Top 10 shareholders:
The top 10 shareholders together form ~43.38% of the total shareholding, signifying concentrated shareholding. 1st & Main Growth Partners, and AllianceBernstein L.P. are the biggest shareholders, holding the maximum stake in the company at 8.56% and 8.39%, respectively.
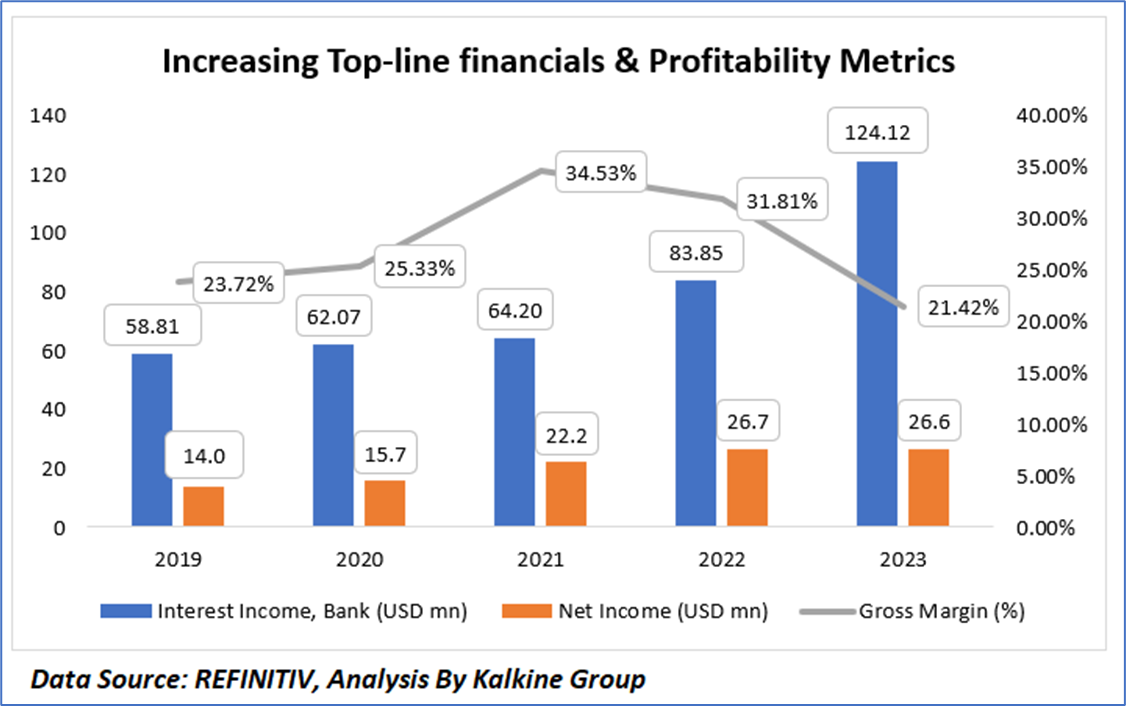
1.4 Key Metrics
Between 2019 and 2023, MainStreet Bancshares, Inc. experienced consistent growth in interest income, rising from USD 58.81 million in 2019 to USD 124.12 million in 2023. Net income also showed a positive trend, increasing from USD 14.0 million in 2019 to a peak of USD 26.7 million in 2022, before a slight decline to USD 26.6 million in 2023. The gross margin fluctuated during this period, reaching its highest point at 34.53% in 2021, followed by a gradual decrease to 21.42% in 2023, reflecting changes in the cost environment and overall operational efficiency.
Section 2: Business Updates and Corporate Business Highlights
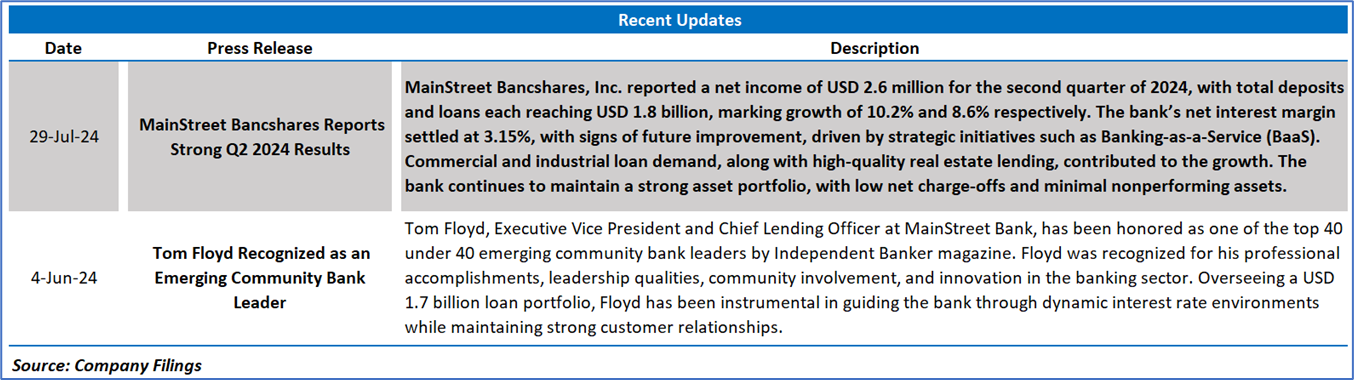
2.1 Recent Updates:
The below picture gives an overview of the recent updates:
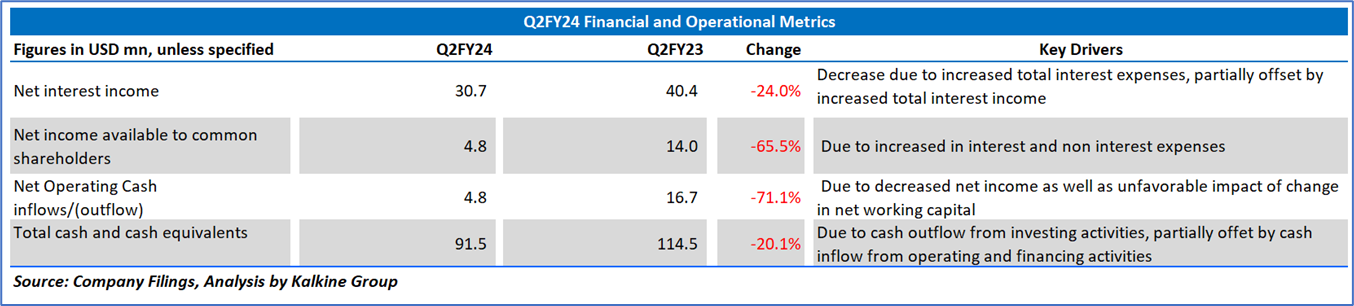
2.2 Insights of Q2FY24:
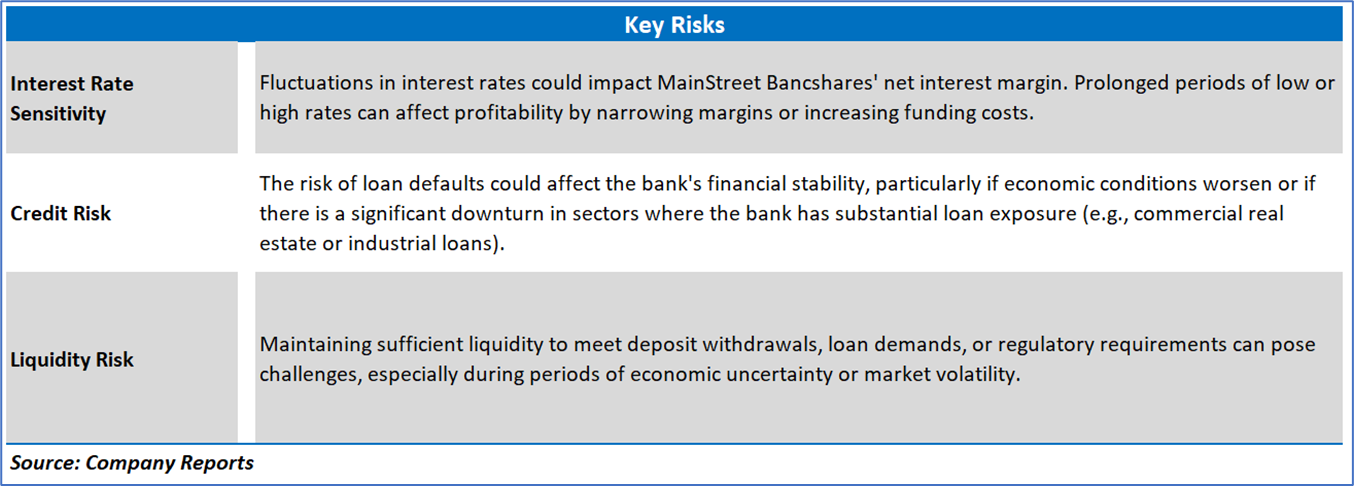
Section 3: Key Risks & Outlook
Section 4: Stock Recommendation Summary:
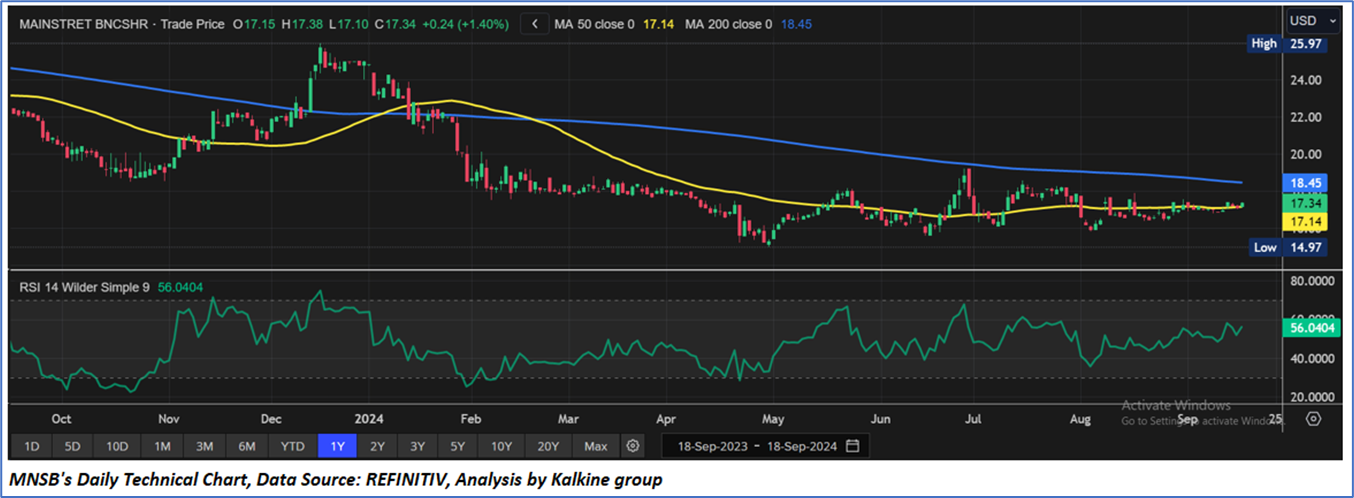
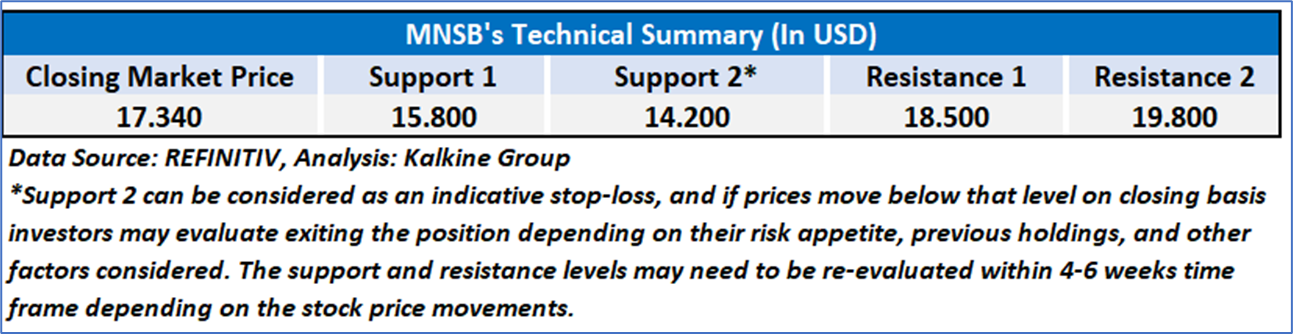
4.1 Price Performance and Technical Summary:
Stock Performance:
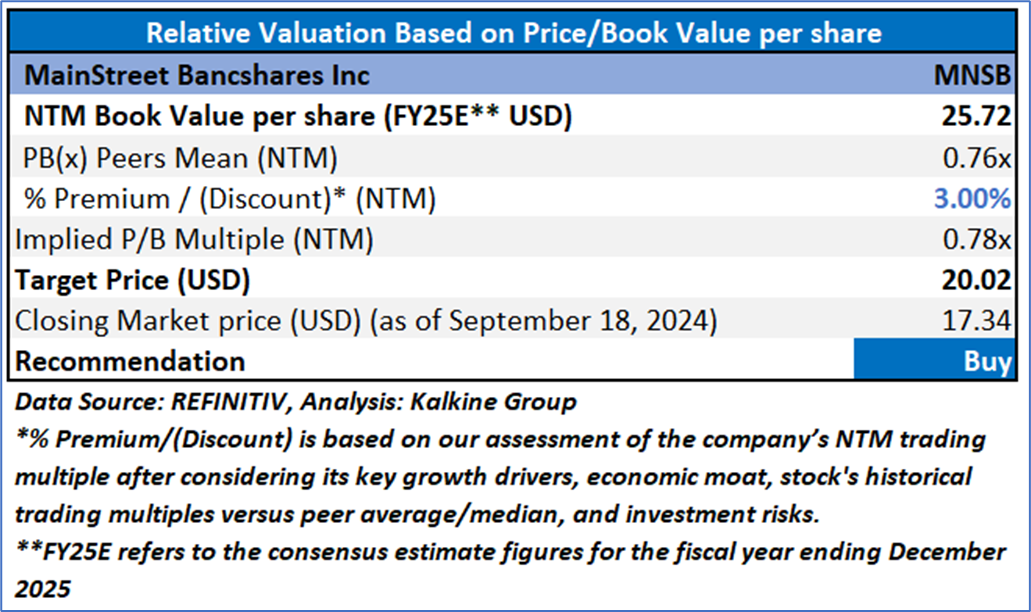
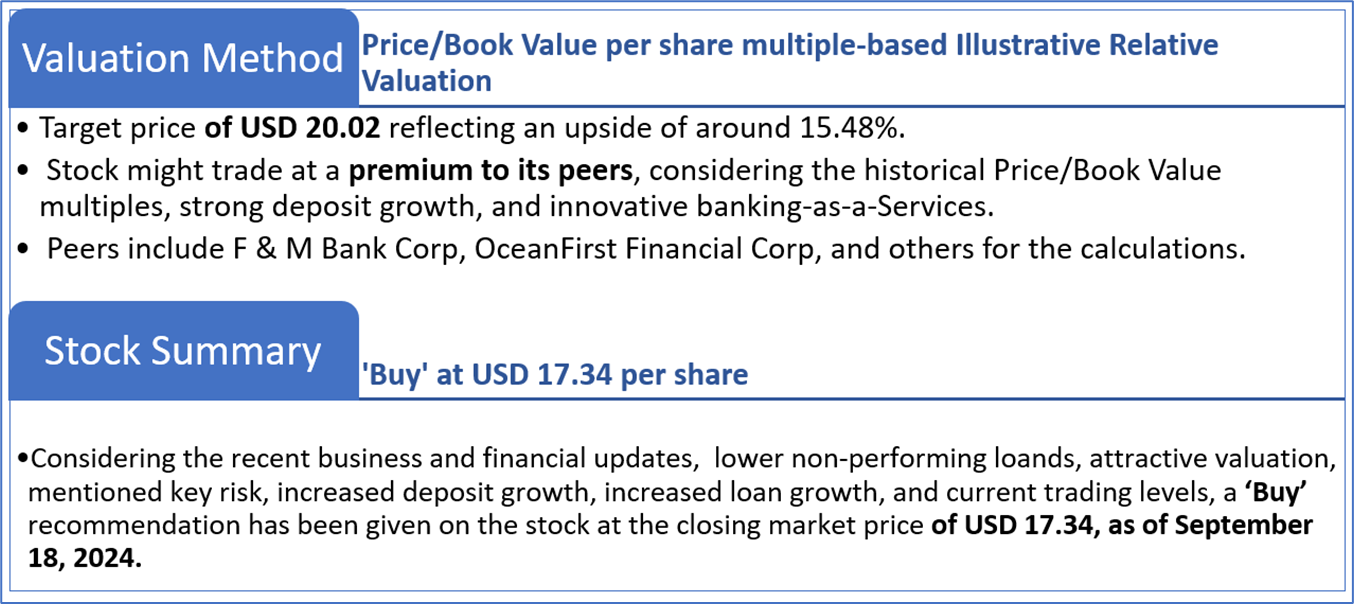
4.2 Fundamental Valuation
Valuation Methodology: Price/Book Value Per Share Multiple Based Relative Valuation
Markets are trading in a highly volatile zone currently due to certain macroeconomic issues and geopolitical tensions prevailing. Therefore, it is prudent to follow a cautious approach while investing.
Note 1: Past performance is not a reliable indicator of future performance.
Note 2: The reference date for all price data, currency, technical indicators, support, and resistance levels is September 18, 2024. The reference data in this report has been partly sourced from REFINITIV.
Note 3: Investment decisions should be made depending on an individual's appetite for upside potential, risks, holding duration, and any previous holdings. An 'Exit' from the stock can be considered if the Target Price mentioned as per the Valuation and or the technical levels provided has been achieved and is subject to the factors discussed above.
Note 4: The report publishing date is as per the Pacific Time Zone.
Technical Indicators Defined: -
Support: A level at which the stock prices tend to find support if they are falling, and a downtrend may take a pause backed by demand or buying interest. Support 1 refers to the nearby support level for the stock and if the price breaches the level, then Support 2 may act as the crucial support level for the stock.
Resistance: A level at which the stock prices tend to find resistance when they are rising, and an uptrend may take a pause due to profit booking or selling interest. Resistance 1 refers to the nearby resistance level for the stock and if the price surpasses the level, then Resistance 2 may act as the crucial resistance level for the stock.
Stop-loss: It is a level to protect against further losses in case of unfavorable movement in the stock prices.
Kalkine Equities LLC, with Delaware File Number 4697384, Foreign Qualification Registration in California File Number 202109211078, and Texas File Number 805521396, is authorized to provide general advice only. The information on https://kalkine.com/ does not take into account any of your investment objectives, financial situation or needs. You should consider the appropriateness of advice taking into account your own objectives, financial situation and needs and seek independent financial advice before making any financial decisions. The link to our Terms and Conditions and Privacy Policy has been provided for your reference. On the date of publishing the reports (mentioned on the website), employees and/or associates of Kalkine do not hold positions in any of the stocks covered on the website. These stocks can change any time and readers of the reports should not consider these stocks as advice or recommendations later.
Copyright © 2024 Krish Capital Pty Ltd. All rights reserved.
Past performance is not a reliable indicator of future performance.
 Please wait processing your request...