
Section 1: Company Overview, Shariah Compliance Standards and Fundamentals
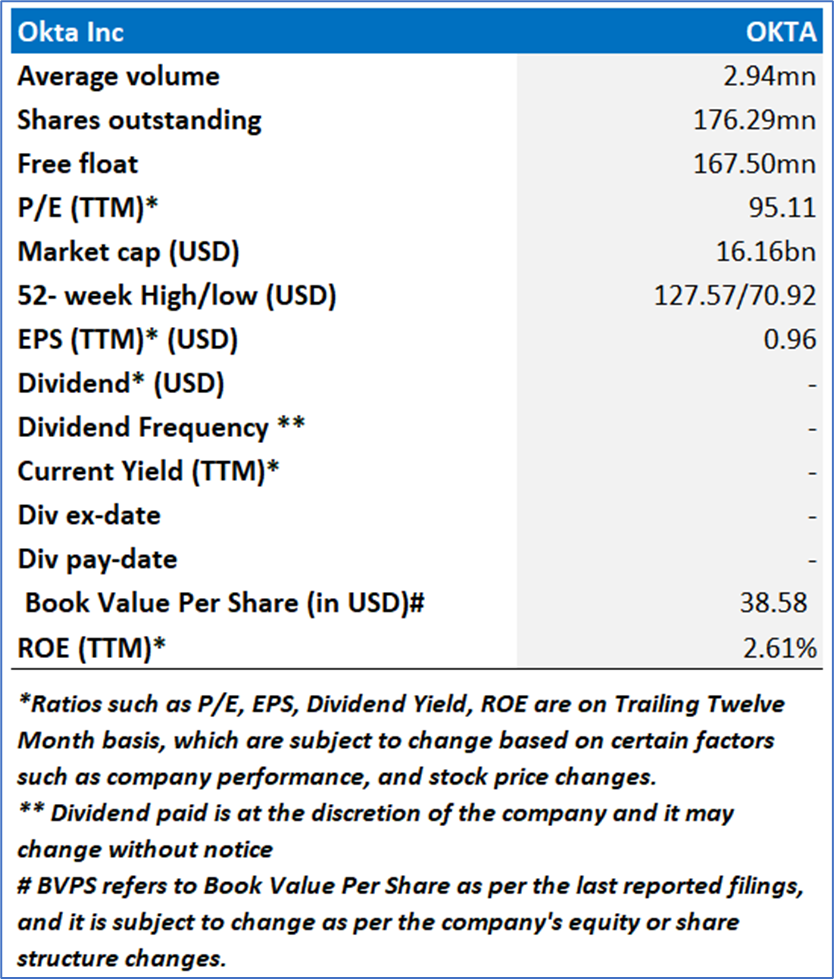
Section 1.1: Okta, Inc. (NASDAQ: OKTA) is an independent identity partner. The Company’s Okta Platform and Auth () Platform enable its customers to securely connect the right people to the right technologies and services at the right time. It offers independent and neutral cloud-based identity solutions that allow customers to integrate with nearly any application, service or cloud that they choose through its platforms.
Kalkine’s ‘The Shariah Compliance Report’ covers the Investment Highlights, Shariah-compliance standards, Key Financial Metrics, Risks, and Technical Analysis along with the Valuation, Target Price, and Recommendation on the stock.
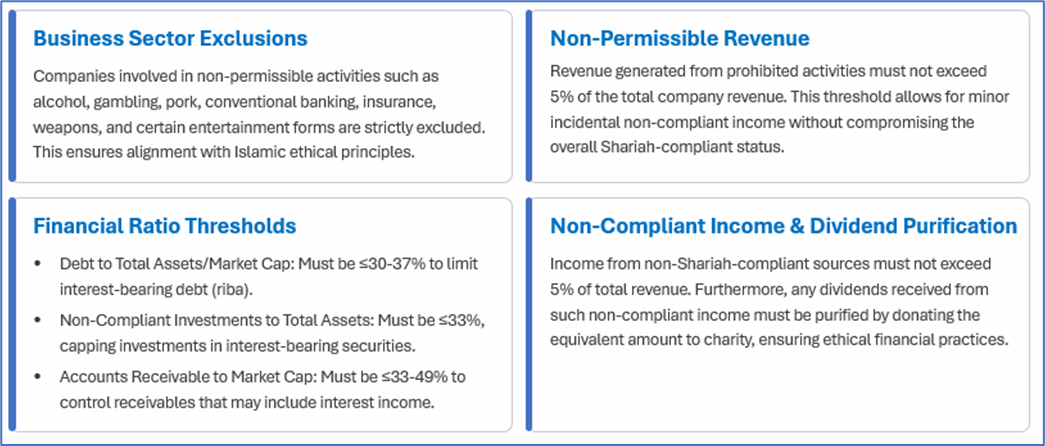
Section 1.2: What are the Key Metrics for Shariah Compliance to be Considered?
The Shariah Compliance Report aims to identify equities that align with Shariah and ethical principles, providing valuable insights on financial metrics, business activities and compliance with Islamic finance norms.
Key Shariah Screening Criteria and Thresholds
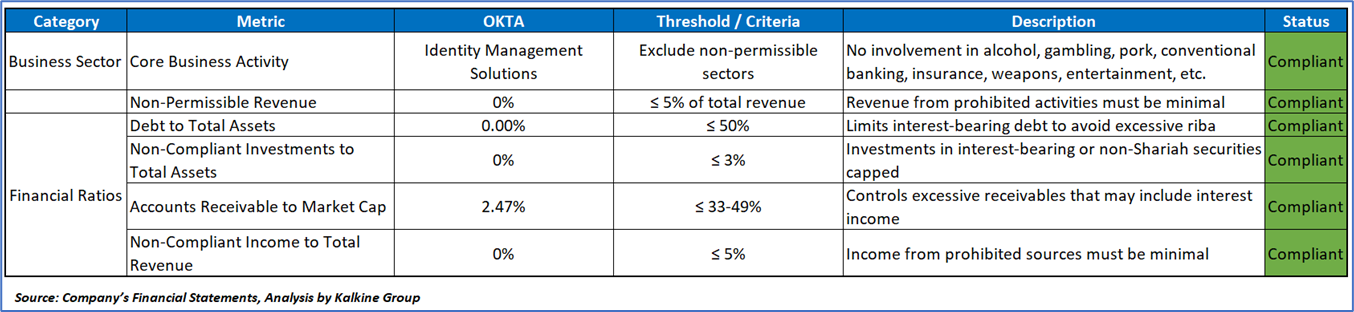
Shariah Metrics for Okta Inc (NASDAQ: OKTA):
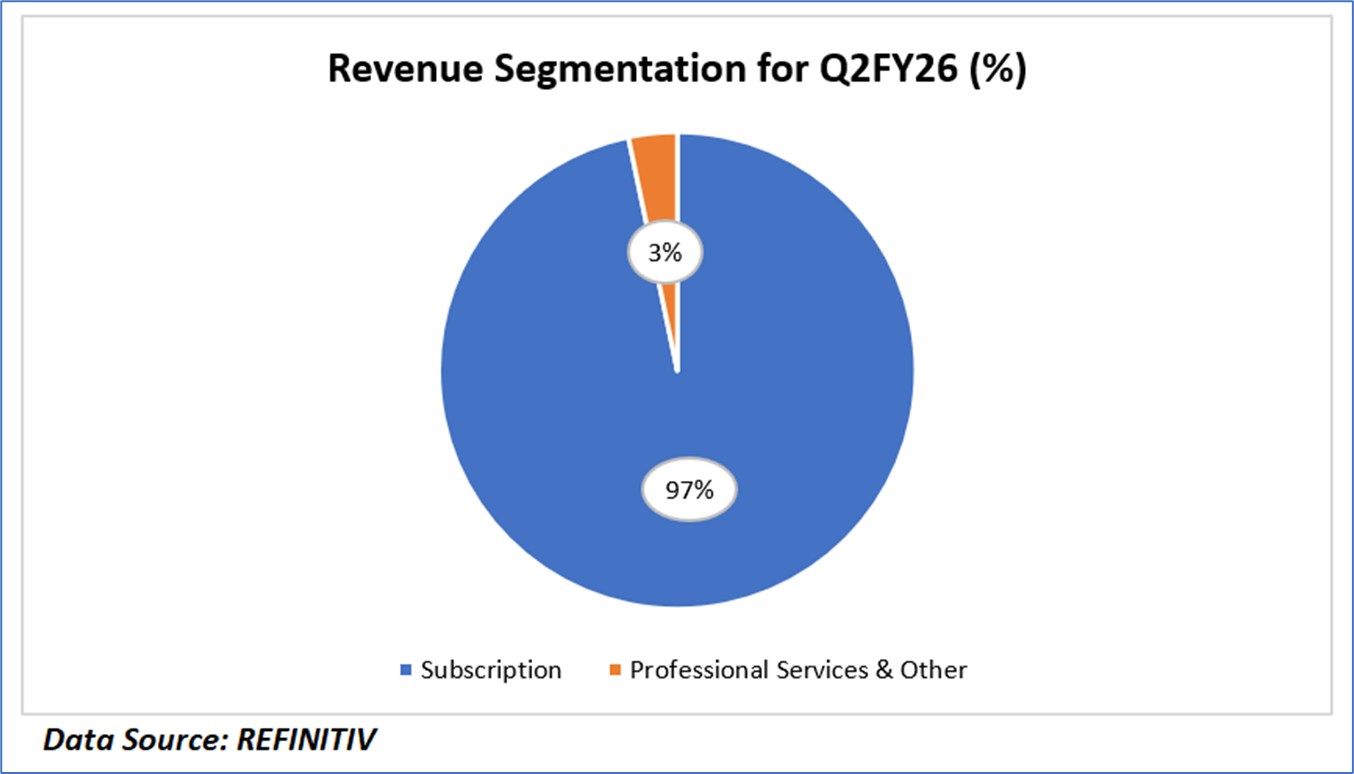
Revenue Segmentation of OKTA in Q2FY25 & Historical Compliance of Financial Ratios:
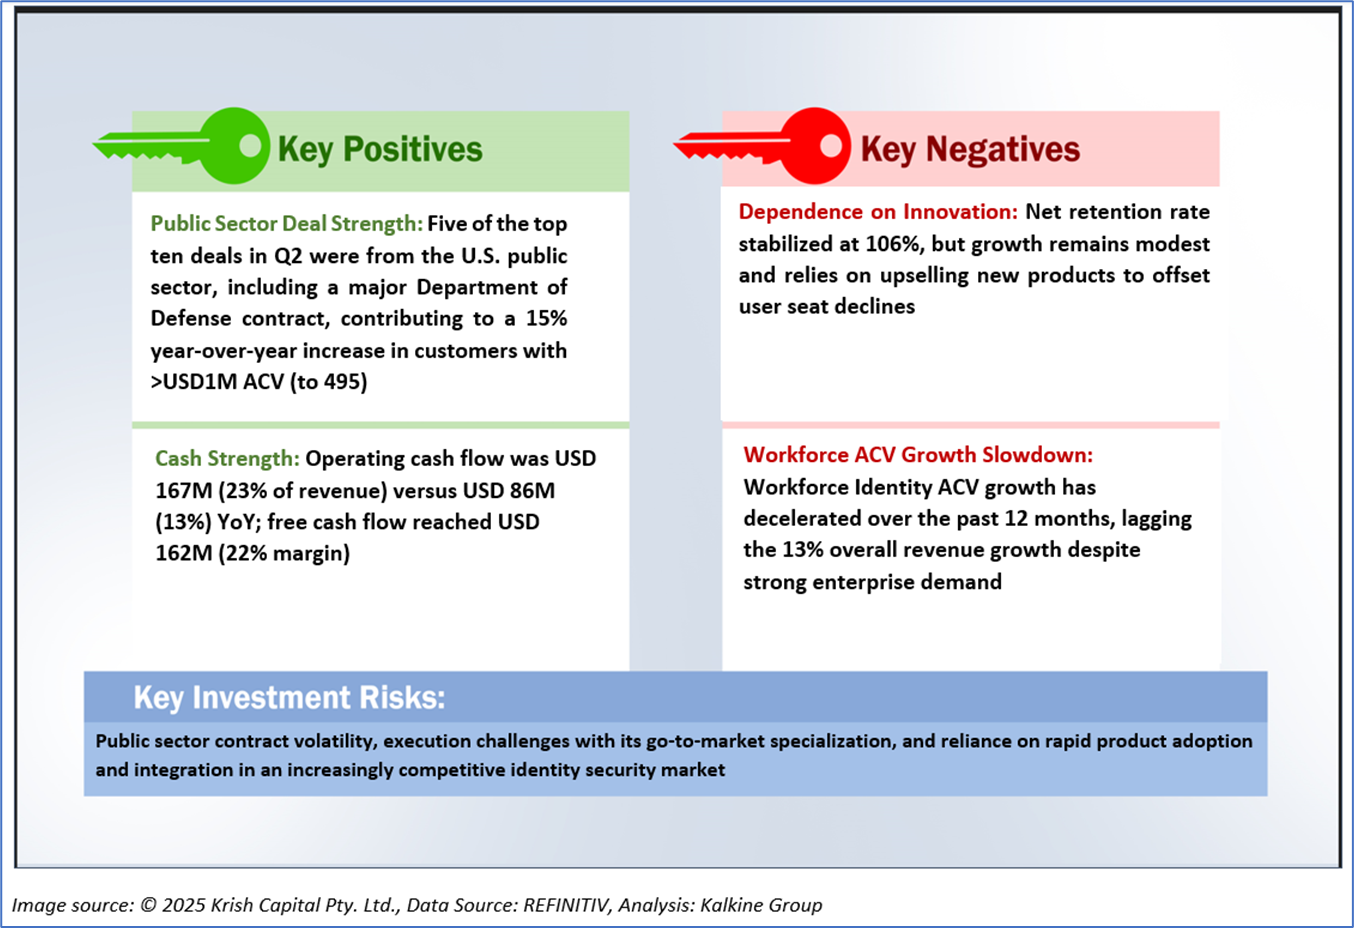
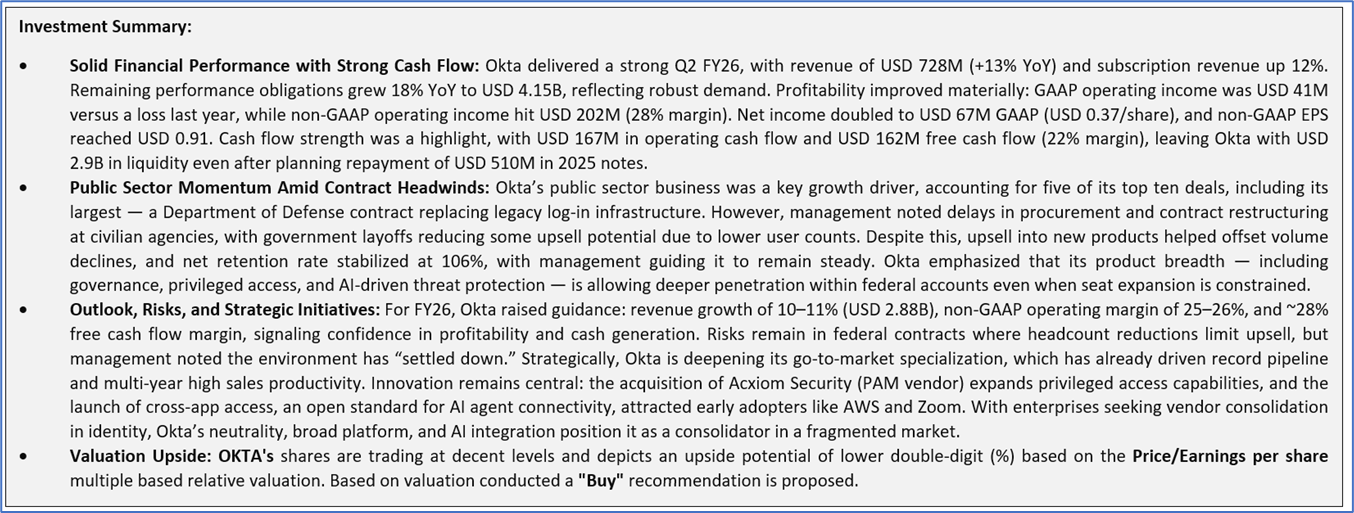
1.3 The Key Positives, Negatives, and Investment summary
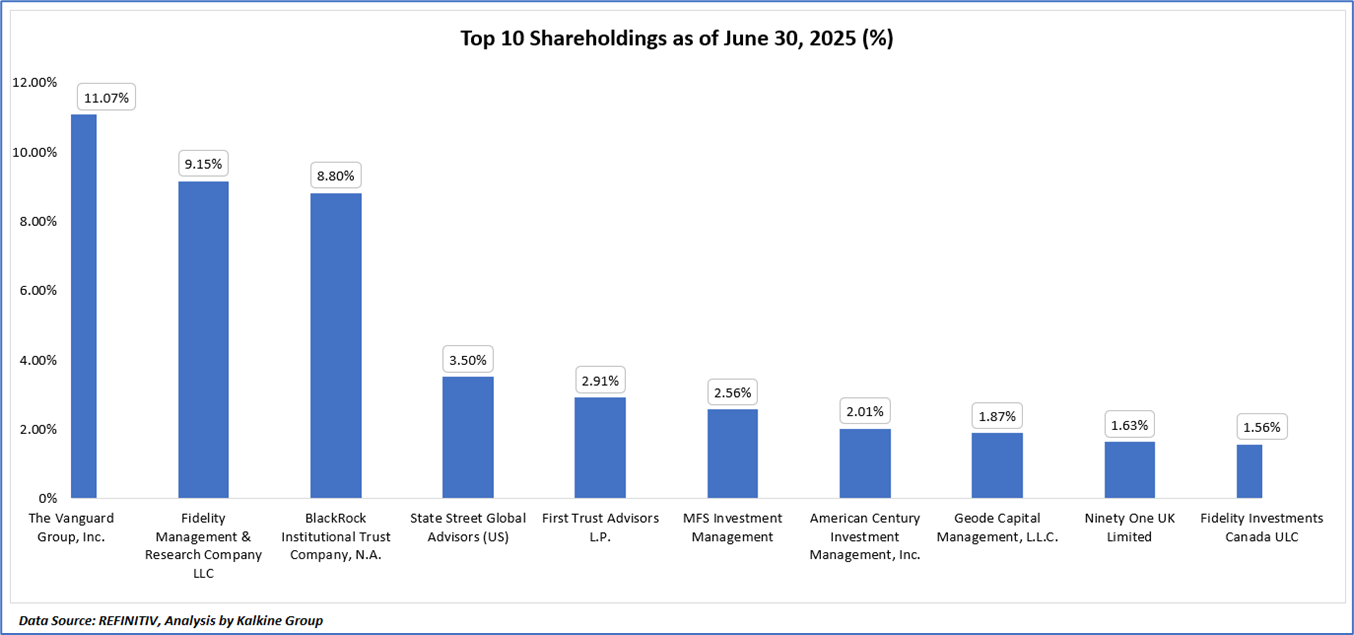
1.4 Top 10 shareholders:
The top 10 shareholders together form ~45.07% of the total shareholding, signifying concentrated shareholding. The Vanguard Group, Inc., and Fidelity Management & Research Company LLC are the biggest shareholders, holding the maximum stake in the company at ~11.07% and ~9.15%, respectively.
1.5 Key Metrics:
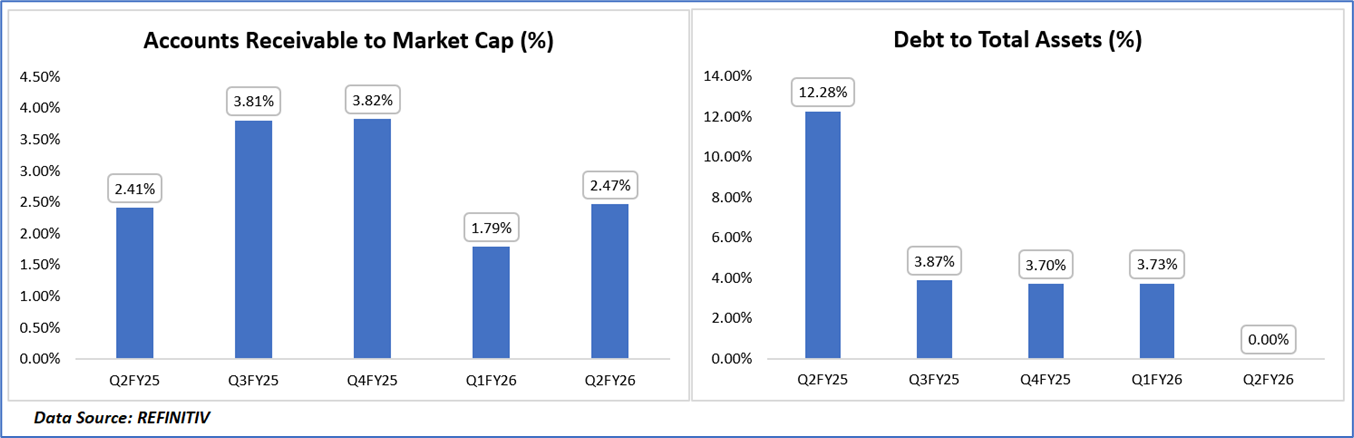
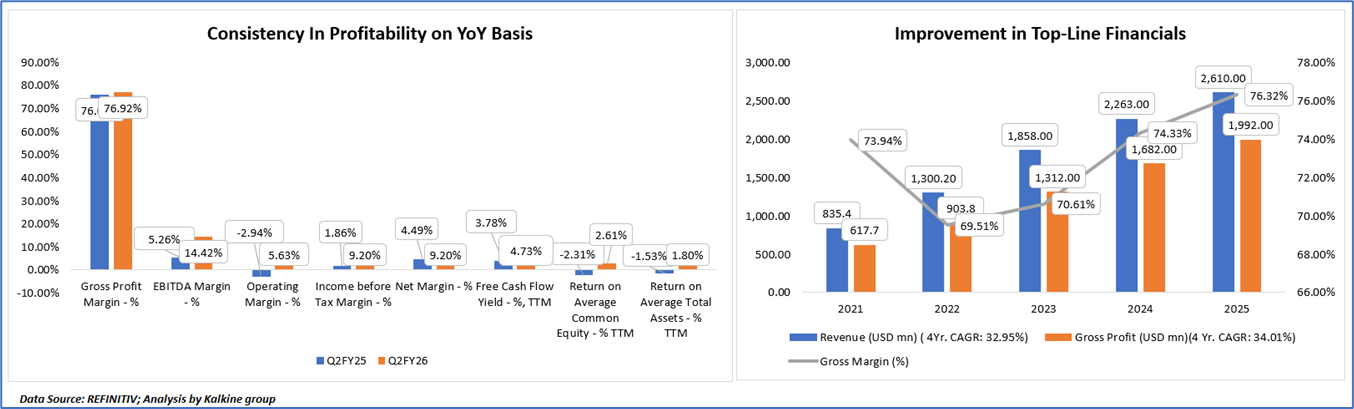
Okta, Inc. (NASDAQ: OKTA) showcased a strong improvement in profitability metrics in Q2 FY2026 compared to Q2 FY2025, reflecting operational efficiency and a maturing business model. The gross profit margin slightly increased from 76.01% to 76.92%, driven by a subscription-heavy revenue mix (96.7% of Q2 FY2026 revenue at USD704 million), while the EBITDA margin nearly tripled from 5.26% to 14.42% and the operating margin shifted from a negative -2.94% to a positive 5.63%, indicating disciplined cost management and scalability. Additionally, income before tax and net margins both rose significantly to 9.20% from 1.86% and 4.49%, respectively, supported by a 13% year-over-year revenue increase to USD728 million, and the trailing twelve-month (TTM) free cash flow yield improved from 3.78% to 4.73%, with returns on average common equity (2.61% from -2.31%) and total assets (1.80% from -1.53%) turning positive, highlighting Okta’s ability to generate sustainable profits and efficiently utilize capital, bolstered by a USD2.9 billion cash reserve and strategic initiatives like the Acxiom Security acquisition.
From 2021 to 2025, Okta sustained robust revenue growth with a 4-year CAGR of 32.95%, rising from USD835.42 million to USD2,610 million, driven by expanding enterprise and public sector adoption, with gross profit growing at a slightly higher 34.01% CAGR to USD1,992 million, reflecting strong pricing power and operational leverage. Despite a dip in gross margin to 69.51% in 2022, likely due to scaling costs and cloud infrastructure investments, it rebounded to 76.32% by 2025, signaling a maturing cost structure and a resilient SaaS model. The company’s focus on new products (e.g., Okta Identity Governance, Privilege Access) and go-to-market specialization, which drove a 15% year-over-year increase in customers with over USD1M ACV to 495 and a 106% net retention rate in Q2 FY2026, positions Okta for continued growth, though challenges like decelerating Workforce Identity ACV, public sector contract restructuring, and competitive pressures from platform players like Palo Alto/CyberArk could impact future margin expansion if not managed effectively.
Section 2: Business Updates and Financial Highlights
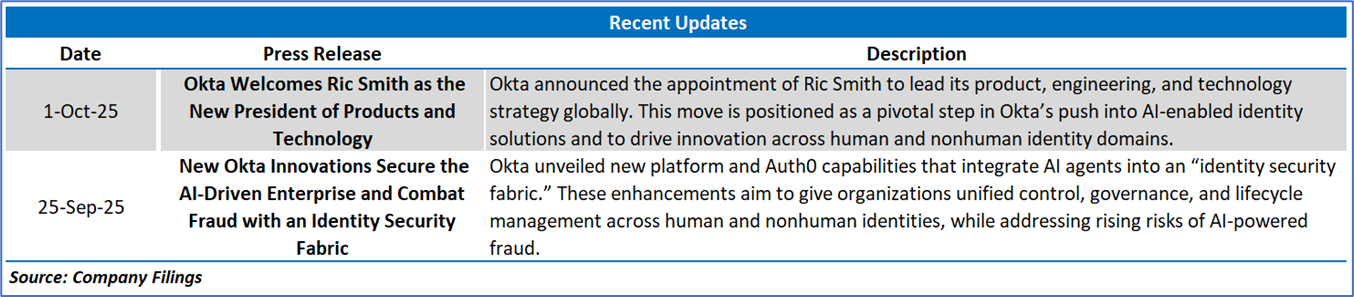
2.1 Recent Updates:
The below picture gives an overview of the recent updates:
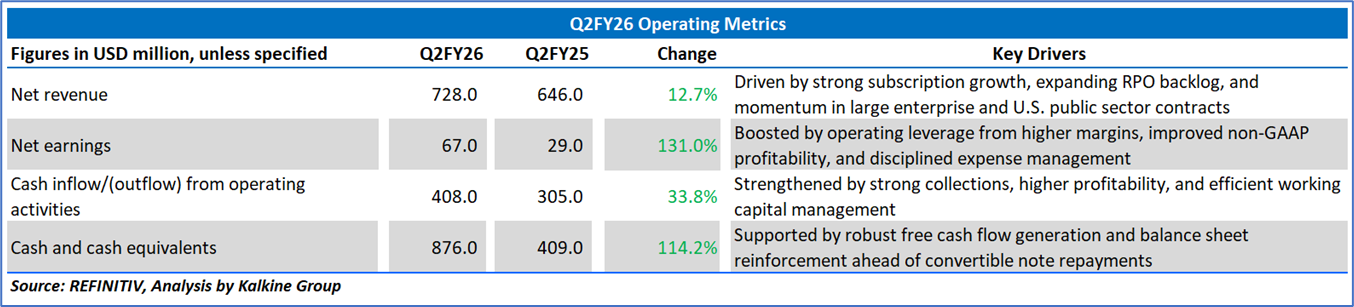
2.2 Insights of Q2FY26:
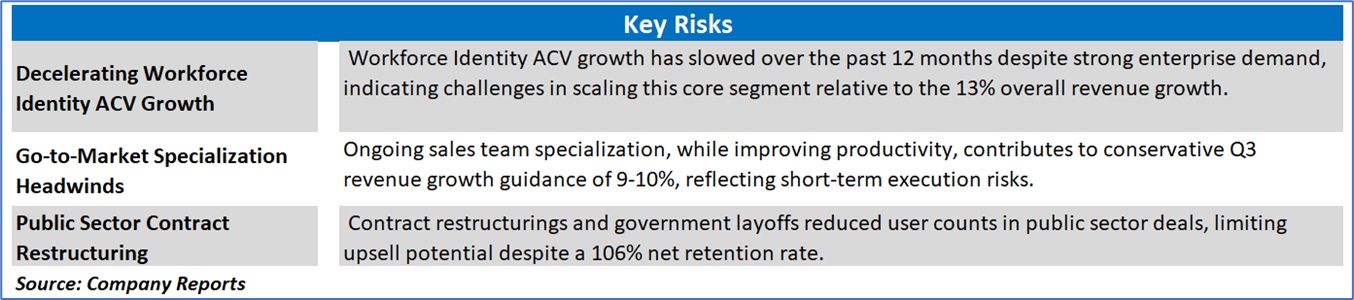
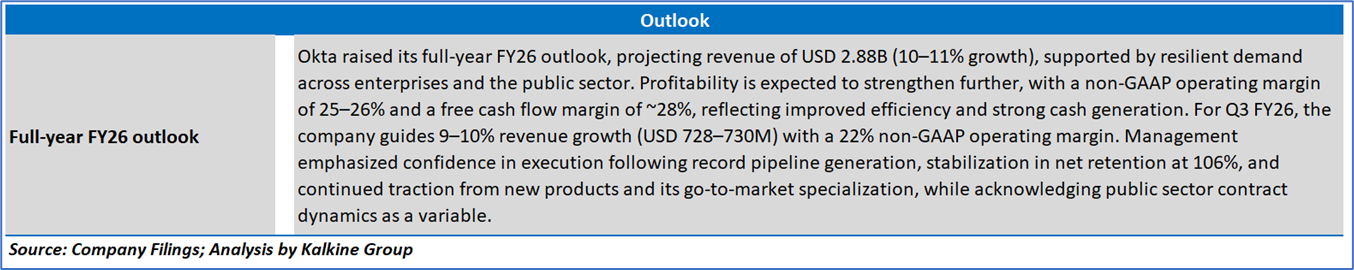
Section 3: Key Risks and Outlook:
Section 4: Stock Recommendation Summary:
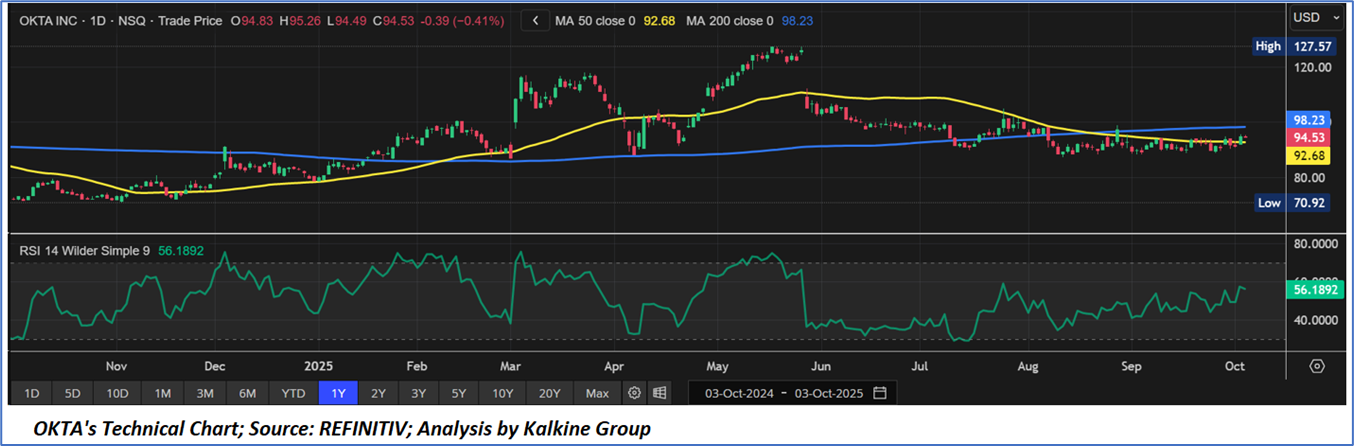
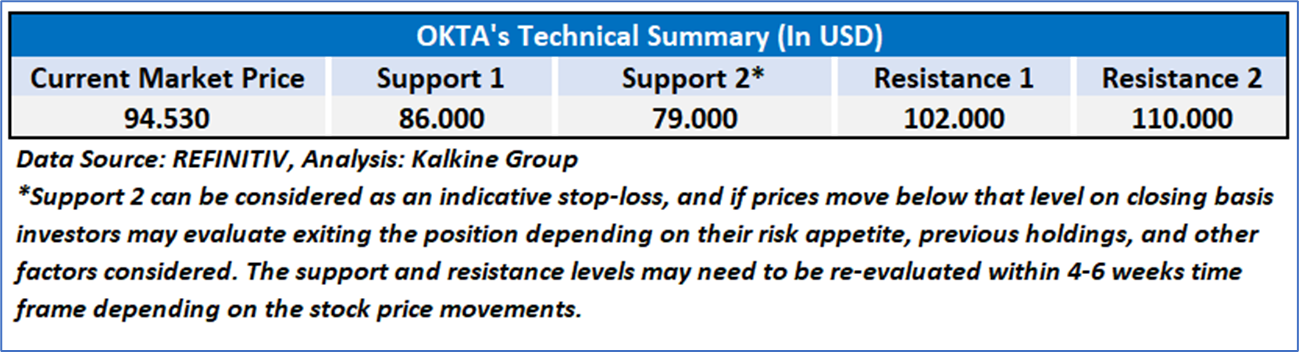
4.1 Technical Summary:
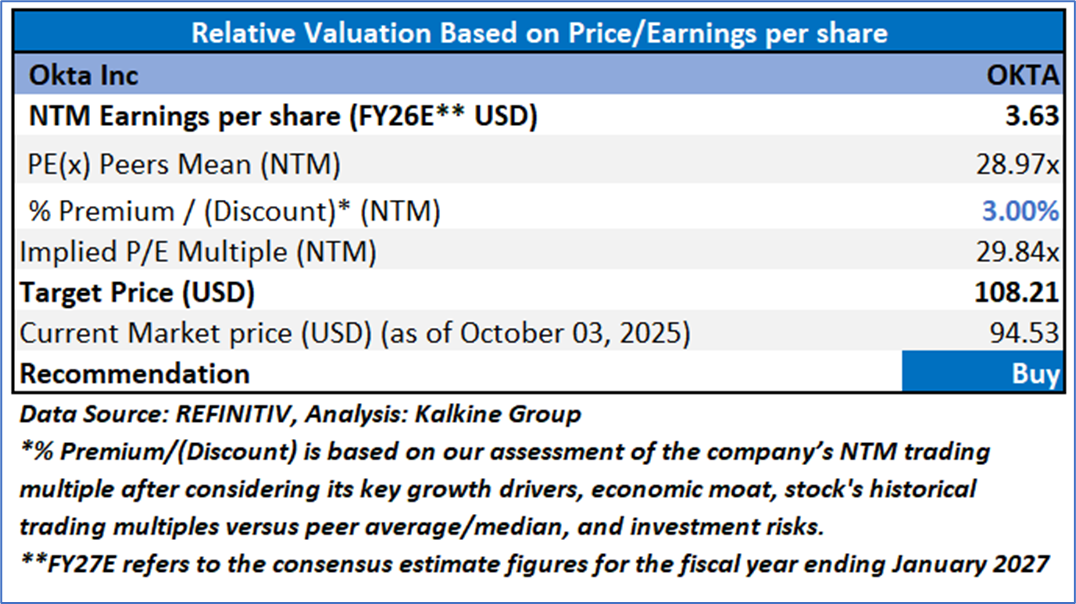
4.2 Fundamental Valuation
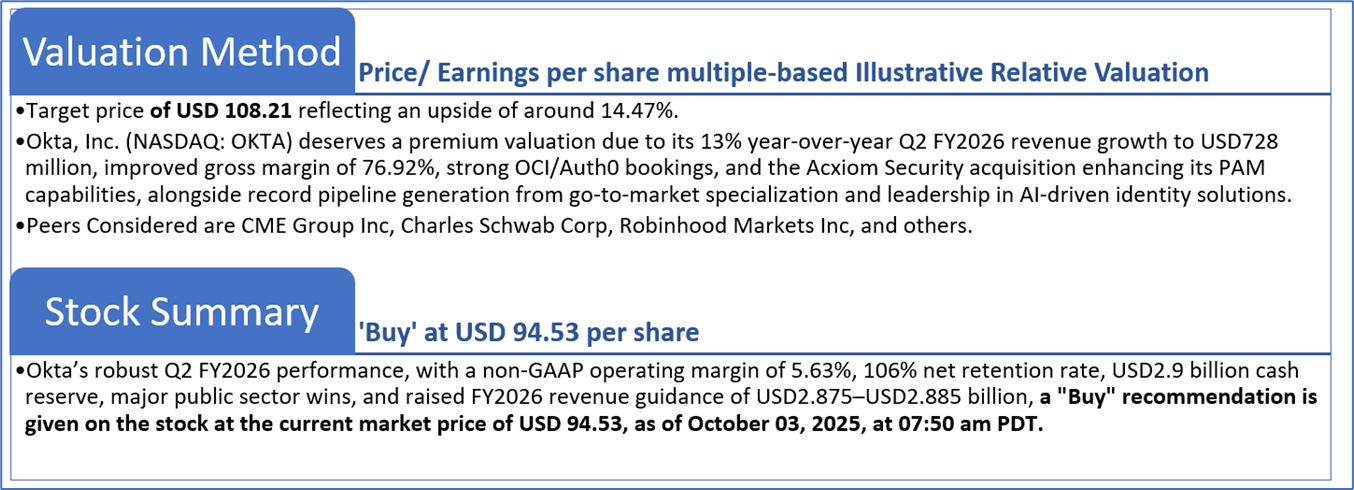
Valuation Methodology: Price/Earnings Per Share Multiple Based Relative Valuation
Markets are trading in a highly volatile zone currently due to certain macroeconomic issues and geopolitical tensions prevailing. Therefore, it is prudent to follow a cautious approach while investing.
Note 1: Past performance is not a reliable indicator of future performance.
Note 2: The reference date for all price data, currency, technical indicators, support, and resistance levels is October 03, 2025. The reference data in this report has been partly sourced from REFINITIV.
Note 3: Investment decisions should be made depending on an individual's appetite for upside potential, risks, holding duration, and any previous holdings. An 'Exit' from the stock can be considered if the Target Price mentioned as per the Valuation and or the technical levels provided have been achieved and is subject to the factors discussed above.
Note 4: The report publishing date is as per the Pacific Time Zone.
Technical Indicators Defined: -
Support: A level at which the stock prices tend to find support if they are falling, and a downtrend may take a pause backed by demand or buying interest. Support 1 refers to the nearby support level for the stock and if the price breaches the level, then Support 2 may act as the crucial support level for the stock.
Resistance: A level at which the stock prices tend to find resistance when they are rising, and an uptrend may take a pause due to profit booking or selling interest. Resistance 1 refers to the nearby resistance level for the stock and if the price surpasses the level, then Resistance 2 may act as the crucial resistance level for the stock.
Stop-loss: It is a level to protect against further losses in case of unfavorable movement in the stock prices.
Kalkine Equities LLC, with Delaware File Number 4697384, Foreign Qualification Registration in California File Number 202109211078, and Texas File Number 805521396, is authorized to provide general advice only. The information on https://kalkine.com/ does not take into account any of your investment objectives, financial situation or needs. You should consider the appropriateness of advice taking into account your own objectives, financial situation and needs and seek independent financial advice before making any financial decisions. The link to our Terms and Conditions and Privacy Policy has been provided for your reference. On the date of publishing the reports (mentioned on the website), employees and/or associates of Kalkine do not hold positions in any of the stocks covered on the website. These stocks can change any time and readers of the reports should not consider these stocks as advice or recommendations later.
Past performance is not a reliable indicator of future performance.
 Please wait processing your request...