Section 1: Company Fundamentals
1.1 Company Overview and Performance summary
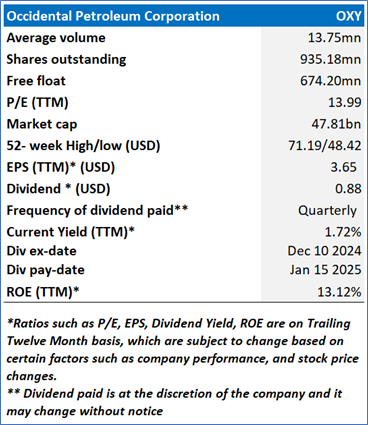
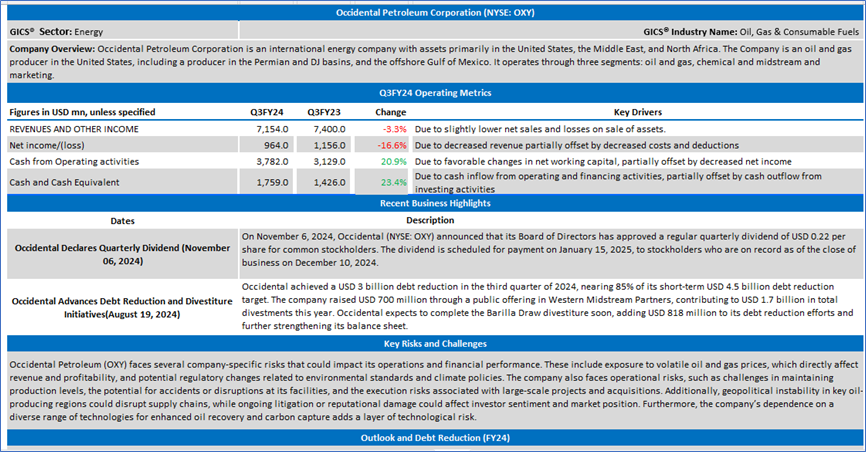
Company Overview:
Occidental Petroleum Corporation (NYSE: OXY) is an international energy company with assets primarily in the United States, the Middle East, and North Africa. The Company is an oil and gas producer in the United States, including a producer in the Permian and DJ basins, and the offshore Gulf of Mexico. It operates through three segments: oil and gas, chemical and midstream and marketing.
This US Inflation Report covers the Company Overview & Price performance, Summary table, Key positives & negatives, Key metrics, Company details, technical guidance & Stock recommendation, and Price chart.
Price Performance:
1.2 Summary Table
1.3 The Key Positives & Negatives

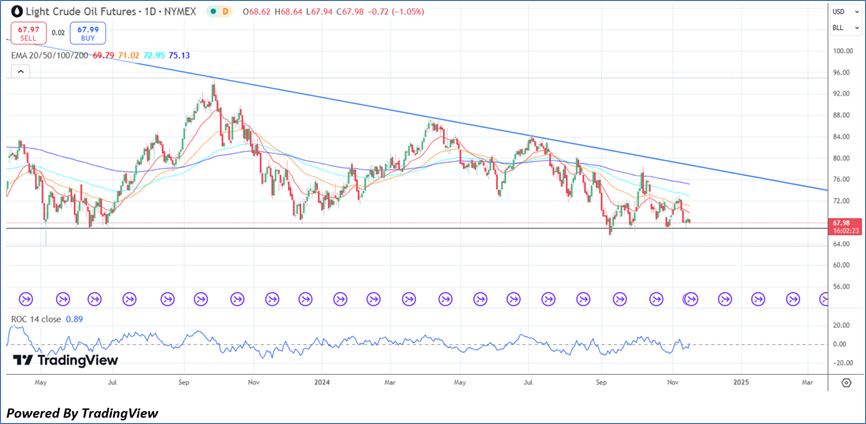
1.4 Underlying Commodity Analysis
WTI crude oil futures declined towards USD68 per barrel on Friday, poised to end the week with a loss, ending a three-week streak of gains. This downturn was driven by concerns over a potential shift to an oversupply in the global oil market. The International Energy Agency (IEA) forecasted an oil surplus for the following year, citing slower demand growth in China and increased global production. The surplus could be exacerbated if OPEC+ proceeds with plans to restore previously halted production. Additionally, a stronger US dollar, which reached a two-year high, made dollar-priced commodities less attractive. U.S. Energy Information Administration (EIA) data also revealed a 2.1 million-barrel increase in U.S. crude inventories last week, surpassing the anticipated 1.9 million-barrel rise. However, there was a significant 4.4-million-barrel drawdown in gasoline stocks, marking the lowest level for this time of year in the past decade.
Section 2: Occidental Petroleum Corporation (NYSE: OXY) (“Buy” at the closing market price of USD 50.67, as of November 14, 2024)
2.1 Company Details
2.2 Technical Guidance and Stock Recommendation

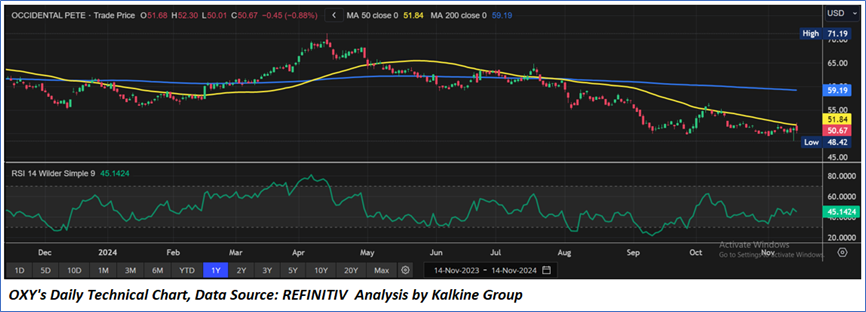
Markets are trading in a highly volatile zone currently due to certain macroeconomic issues and geopolitical tensions prevailing. Therefore, it is prudent to follow a cautious approach while investing.
Note 1: Past performance is not a reliable indicator of future performance.
Note 2: The reference date for all price data, currency, technical indicators, support, and resistance levels is November 14, 2024. The reference data in this report has been partly sourced from REFINITIV.
Note 3: Investment decisions should be made depending on an individual's appetite for upside potential, risks, holding duration, and any previous holdings. An 'Exit' from the stock can be considered if the Target Price mentioned as per the Valuation and or the technical levels provided has been achieved and is subject to the factors discussed above.
Note 4: The report publishing date is as per the Pacific Time Zone.
Technical Indicators Defined: -
Support: A level at which the stock prices tend to find support if they are falling, and a downtrend may take a pause backed by demand or buying interest. Support 1 refers to the nearby support level for the stock and if the price breaches the level, then Support 2 may act as the crucial support level for the stock.
Resistance: A level at which the stocks prices tend to find resistance when they are rising, and an uptrend may take a pause due to profit booking or selling interest. Resistance 1 refers to the nearby resistance level for the stock and if the price surpasses the level, then Resistance 2 may act as the crucial resistance level for the stock.
Stop-loss: It is a level to protect against further losses in case of unfavorable movement in the stock prices.
Kalkine Equities LLC, with Delaware File Number 4697384, Foreign Qualification Registration in California File Number 202109211078, and Texas File Number 805521396, is authorized to provide general advice only. The information on https://kalkine.com/ does not take into account any of your investment objectives, financial situation or needs. You should consider the appropriateness of advice taking into account your own objectives, financial situation and needs and seek independent financial advice before making any financial decisions. The link to our Terms and Conditions and Privacy Policy has been provided for your reference. On the date of publishing the reports (mentioned on the website), employees and/or associates of Kalkine do not hold positions in any of the stocks covered on the website. These stocks can change any time and readers of the reports should not consider these stocks as advice or recommendations later.
Past performance is not a reliable indicator of future performance.
 Please wait processing your request...