Section 1: Company Overview and Fundamentals
1.1 Company Overview:
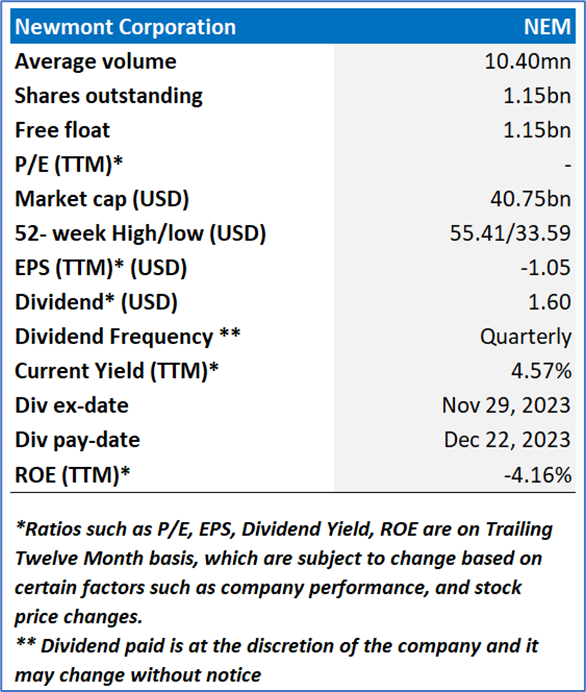
Newmont Corporation (NYSE: NEM) is a gold company and a producer of copper, silver, zinc, and lead. The Company’s portfolio of assets and prospects is anchored in mining jurisdictions in North America, South America, Australia, and Africa. The Company's segments are each of its 12 mining operations and its 38.5% interest in Nevada Gold Mines (NGM).
Kalkine’s Dividend Income Report covers the Company Overview, Key positives & negatives, Investment summary, Key investment metrics, Top 10 shareholding, Business updates and insights into company recent financial results, Key Risks & Outlook, Price performance and technical summary, Target Price, and Recommendation on the stock.
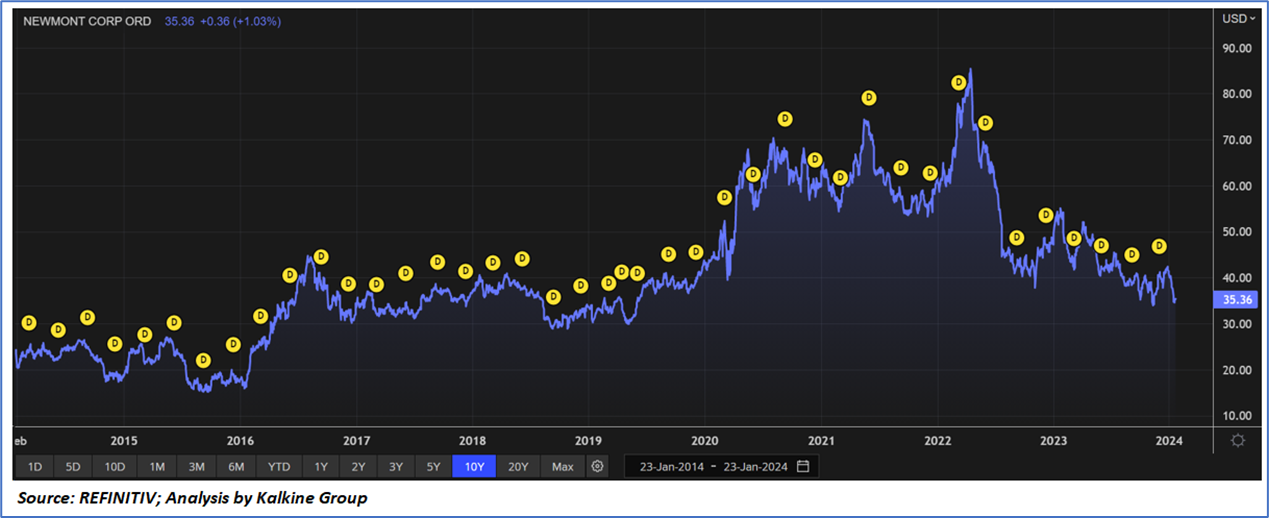
Stock Performance:
1.2 The Key Positives, Negatives, and Investment summary


1.3 Top 10 shareholders:
The top 10 shareholders together form ~25.82% of the total shareholding, signifying diverse shareholding. The Vanguard Group, Inc. and BlackRock Institutional Trust Company, N.A. are the biggest shareholders, holding the maximum stake in the company at ~7.14% and ~4.32%, respectively.

1.4 Consistent dividend payments with impressive dividend yield:
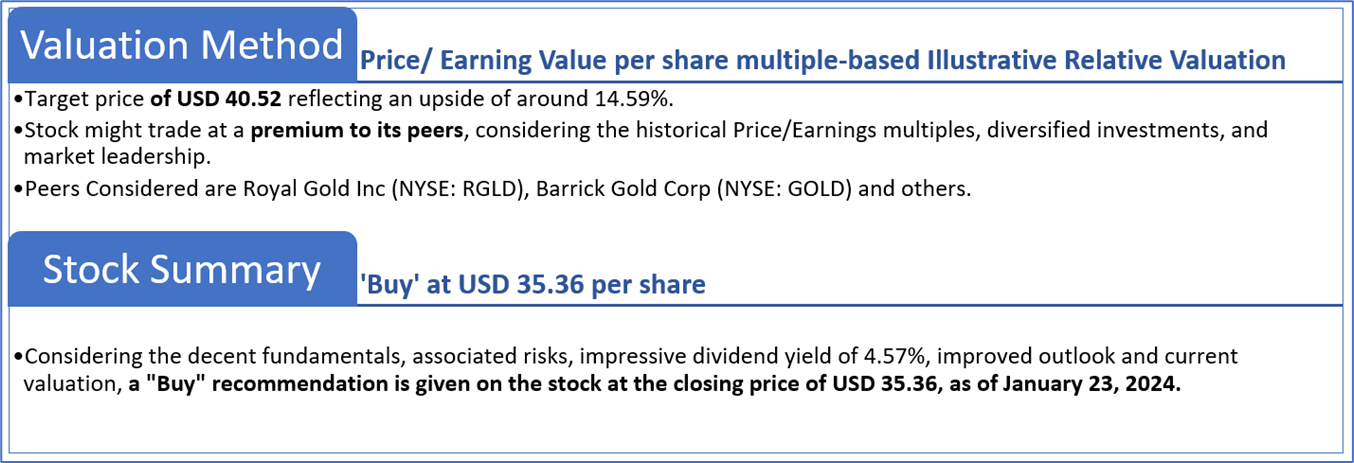
Operating within its established framework, The Board of Directors declared a dividend of USD 0.40 per share for Q3 2023, payable on December 22, 2023, adhering to the established framework. The annualized dividend payout range for 2023 is projected at USD 1.40 to USD 1.80 per share, contingent on quarterly approval by the Board of Directors, reflecting a balanced approach with a sustainable base dividend and incremental payout calibrated at the mid-point of the USD 1,700 per ounce annualized range. This leads to a dividend yield of 4.57% as per the last closing price.
1.5 Key Metrics
NEM has experienced a positive trajectory in its top-line revenue and profitability figures over the past five years. Additionally, the company has demonstrated effective cost management across various operational levels can be seen through the higher profitability metrics.

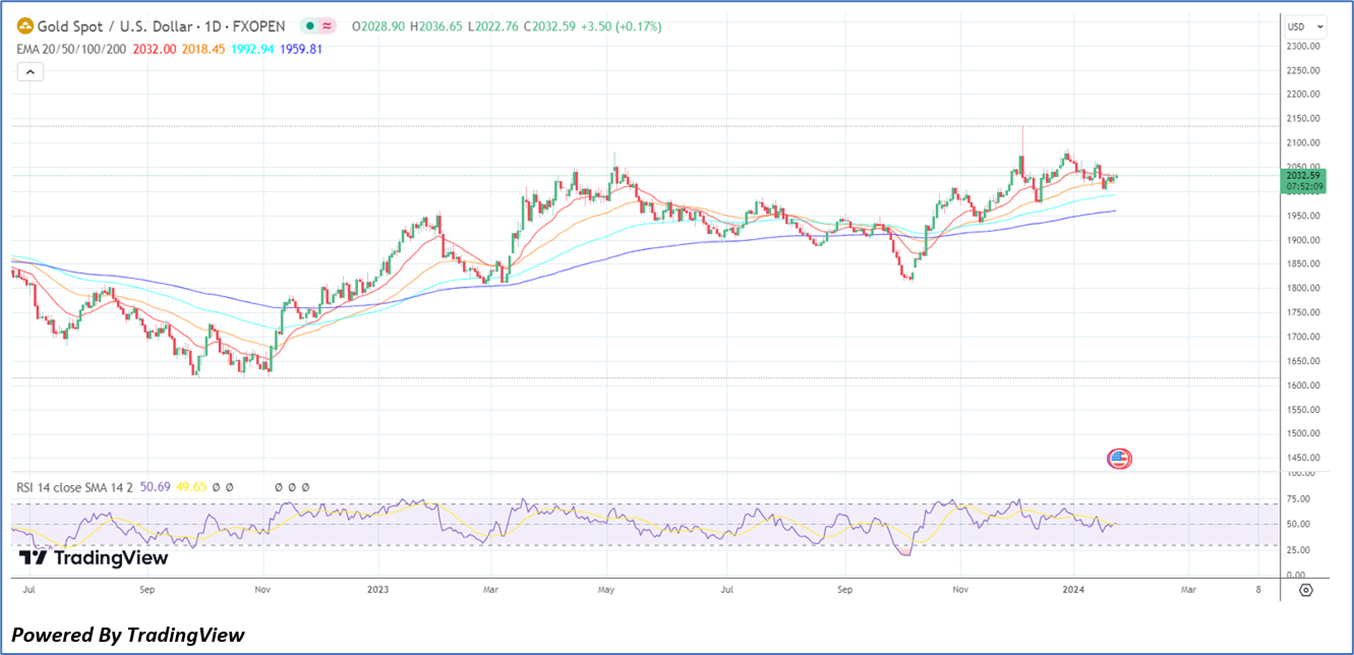
1.6 Gold Commodity Analysis:
Gold stabilized around USD 2,025 per ounce, maintaining a sideways trading pattern throughout the week as investors await crucial US economic indicators, including PMI, GDP, and PCE inflation data. Despite this, the precious metal faces downward pressure due to the robustness of the US economy and hawkish signals from Federal Reserve officials, reducing expectations for a March interest rate cut. Current market sentiment indicates a probability of less than 50% for a Fed rate cut in March, a significant decline from the nearly two-thirds probability observed a week ago, as reported by CME's FedWatch Tool. In contrast, the Bank of Japan, while keeping ultra-loose monetary policies on Tuesday, hinted at a more hawkish stance through Governor Kazuo Ueda's recent comments on inflation. The European Central Bank is set to announce its monetary policy decision on Thursday, with expectations leaning toward a steady rate and a resistance to speculations of early rate reductions.
Section 2: Business Updates and Financial Highlights
2.1 Recent Updates:
The below picture gives an overview of the recent updates:

2.2 Insights of Q3FY23:

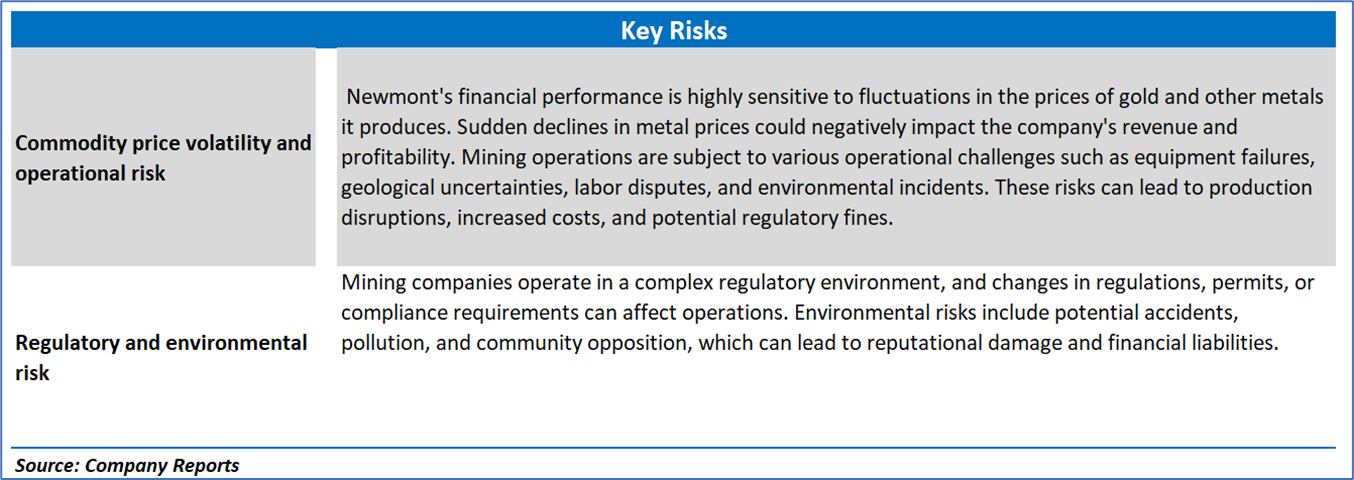
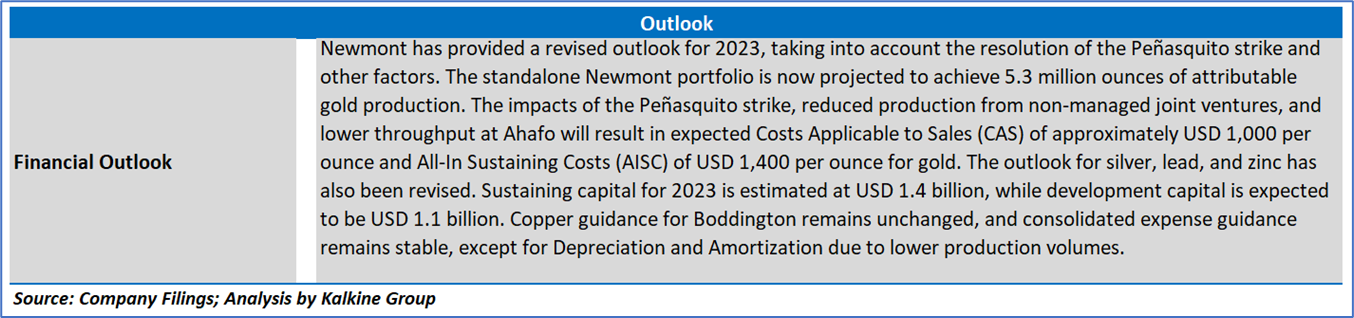
Section 3: Key Risks and Outlook:
Section 4: Stock Recommendation Summary:
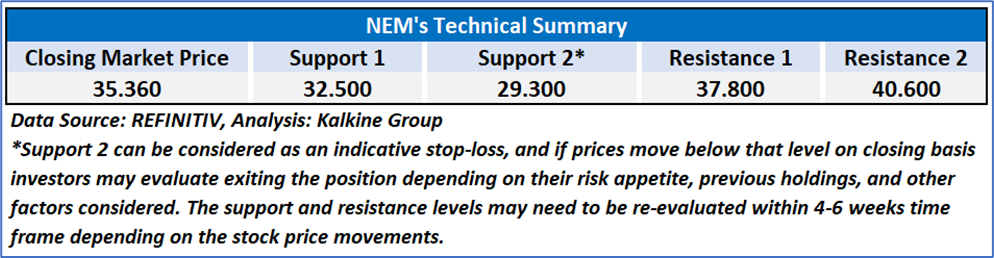
4.1 Price Performance and Technical Summary:
Stock Performance:

4.2 Fundamental Valuation
Valuation Methodology: Price/Earnings Per Share Multiple Based Relative Valuation

Markets are trading in a highly volatile zone currently due to certain macroeconomic issues and geopolitical tensions prevailing. Therefore, it is prudent to follow a cautious approach while investing.
Note 1: Past performance is not a reliable indicator of future performance.
Note 2: The reference date for all price data, currency, technical indicators, support, and resistance levels is January 23, 2024. The reference data in this report has been partly sourced from REFINITIV.
Note 3: Investment decisions should be made depending on an individual's appetite for upside potential, risks, holding duration, and any previous holdings. An 'Exit' from the stock can be considered if the Target Price mentioned as per the Valuation and or the technical levels provided has been achieved and is subject to the factors discussed above.
Note 4: The report publishing date is as per the Pacific Time Zone.
Technical Indicators Defined: -
Support: A level at which the stock prices tend to find support if they are falling, and a downtrend may take a pause backed by demand or buying interest. Support 1 refers to the nearby support level for the stock and if the price breaches the level, then Support 2 may act as the crucial support level for the stock.
Resistance: A level at which the stock prices tend to find resistance when they are rising, and an uptrend may take a pause due to profit booking or selling interest. Resistance 1 refers to the nearby resistance level for the stock and if the price surpasses the level, then Resistance 2 may act as the crucial resistance level for the stock.
Stop-loss: It is a level to protect against further losses in case of unfavorable movement in the stock prices.
Kalkine Equities LLC provides general information about companies and their securities. The information contained in the reports, including any recommendations regarding the value of or transactions in any securities, does not take into account any of your investment objectives, financial situation or needs. Kalkine Equities LLC is not registered as an investment adviser in the U.S. with either the federal or state government. Before you make a decision about whether to invest in any securities, you should take into account your own objectives, financial situation and needs and seek independent financial advice. All information in our reports represents our views as at the date of publication and may change without notice.
Kalkine Media LLC, an affiliate of Kalkine Equities LLC, may have received, or be entitled to receive, financial consideration in connection with providing information about certain entity(s) covered on its website.
Past performance is not a reliable indicator of future performance.
 Please wait processing your request...