Section 1: Company Overview and Fundamentals
1.1 Company Overview:
Newmont Corporation (NYSE: NEM) is a gold company and a producer of copper, silver, zinc, and lead. The Company’s portfolio of assets and prospects is anchored in mining jurisdictions in North America, South America, Australia, and Africa. The Company's segments are each of its 12 mining operations and its 38.5% interest in Nevada Gold Mines (NGM).
Kalkine’s Dividend Income Report covers the Company Overview, Key positives & negatives, Investment summary, Key investment metrics, Top 10 shareholding, Business updates and insights into company recent financial results, Key Risks & Outlook, Price performance and technical summary, Target Price, and Recommendation on the stock.
Stock Performance:

1.2 The Key Positives, Negatives, and Investment summary


1.3 Top 10 shareholders:
The top 10 shareholders together form ~37.02% of the total shareholding, signifying diverse shareholding. The Vanguard Group, Inc. and BlackRock Institutional Trust Company, N.A. are the biggest shareholders, holding the maximum stake in the company at ~8.79% and ~6.32%, respectively.

1.4 Consistent dividend payments with impressive dividend yield:
Operating within its established framework, Newmont's Board of Directors announced a dividend of 0.40 USD per share of common stock for the second quarter of 2023. This dividend is scheduled for payment on September 21, 2023, to shareholders recorded on September 7, 2023. The projected annualized dividend payout for 2023 is expected to range between 1.40 and 1.80 USD per share, subject to quarterly approval by the Board of Directors. The second quarter dividend payout was set at the midpoint of the annualized payout range of 1,700 USD per ounce, considering a sustainable base dividend of 1.00 USD per share linked to base reserves price, and an additional dividend payout of 0.60 USD per share.

1.5 Key Metrics
PBA has experienced a positive trajectory in its top-line revenue and profitability figures over the past five years. Additionally, the company has demonstrated effective cost management across various operational levels, except for gross margin. Despite the slight concern regarding gross margin, PBA's overall financial performance indicates strong growth potential.

1.6 Gold Commodity Analysis:
Gold stabilized around the USD1,900 per ounce mark as investors refrained from making significant decisions in anticipation of the upcoming annual symposium of central bankers at Jackson Hole, during which policymakers might outline their monetary perspectives. Despite this, the metal maintained its proximity to its lowest levels in five months due to a robust dollar and Treasury yields, driven by expectations that the Federal Reserve will uphold its restrictive policy stance. The minutes of the Fed's July meeting, released last week, indicated the possibility of further interest rate hikes due to inflation risks. Conversely, the likelihood of additional rate hikes by the ECB has diminished after recent PMI data revealed a deeper decline in business activity across major European countries. In another context, China's central bank reduced its one-year loan prime rate by ten basis points, establishing a record low of 3.45% during its August fixing, while keeping the five-year loan prime rate unchanged at 4.2%.

Section 2: Business Updates and Financial Highlights
2.1 Recent Updates:
The below picture gives an overview of the recent updates:

2.2 Insights of Q2FY23:

Section 3: Key Risks and Outlook:


Section 4: Stock Recommendation Summary:
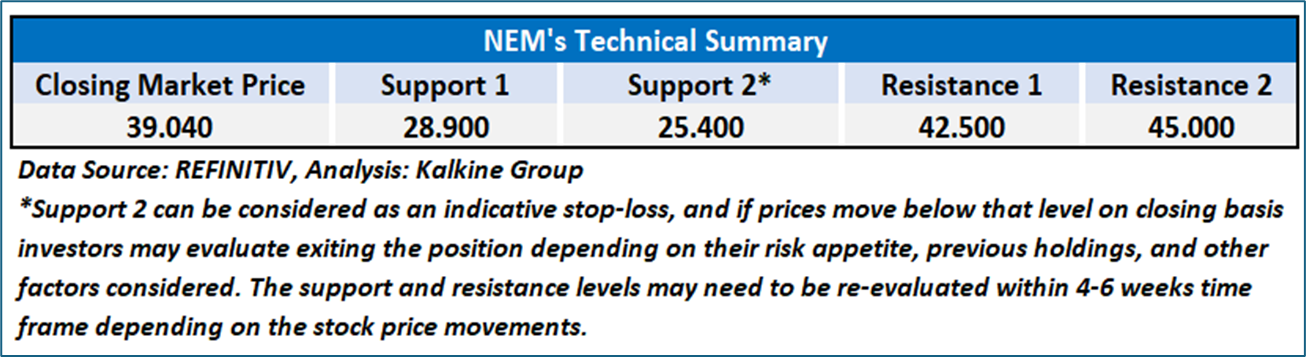
4.1 Price Performance and Technical Summary:
Stock Performance:

4.2 Fundamental Valuation
Valuation Methodology: Price/Earnings Per Share Multiple Based Relative Valuation


Markets are trading in a highly volatile zone currently due to certain macroeconomic issues and geopolitical tensions prevailing. Therefore, it is prudent to follow a cautious approach while investing.
Note 1: Past performance is not a reliable indicator of future performance.
Note 2: The reference date for all price data, currency, technical indicators, support, and resistance levels is August 23, 2023. The reference data in this report has been partly sourced from REFINITIV.
Note 3: Investment decisions should be made depending on an individual's appetite for upside potential, risks, holding duration, and any previous holdings. An 'Exit' from the stock can be considered if the Target Price mentioned as per the Valuation and or the technical levels provided has been achieved and is subject to the factors discussed above.
Note 4: The report publishing date is as per the Pacific Time Zone.
Technical Indicators Defined: -
Support: A level at which the stock prices tend to find support if they are falling, and a downtrend may take a pause backed by demand or buying interest. Support 1 refers to the nearby support level for the stock and if the price breaches the level, then Support 2 may act as the crucial support level for the stock.
Resistance: A level at which the stock prices tend to find resistance when they are rising, and an uptrend may take a pause due to profit booking or selling interest. Resistance 1 refers to the nearby resistance level for the stock and if the price surpasses the level, then Resistance 2 may act as the crucial resistance level for the stock.
Stop-loss: It is a level to protect against further losses in case of unfavorable movement in the stock prices.
Kalkine Equities LLC, with Delaware File Number 4697384, Foreign Qualification Registration in California File Number 202109211078, and Texas File Number 805521396, is authorized to provide general advice only. The information on https://kalkine.com/ does not take into account any of your investment objectives, financial situation or needs. You should consider the appropriateness of advice taking into account your own objectives, financial situation and needs and seek independent financial advice before making any financial decisions. The link to our Terms and Conditions and Privacy Policy has been provided for your reference. On the date of publishing the reports (mentioned on the website), employees and/or associates of Kalkine do not hold positions in any of the stocks covered on the website. These stocks can change any time and readers of the reports should not consider these stocks as advice or recommendations later.
Past performance is not a reliable indicator of future performance.
 Please wait processing your request...